| Abb Ltd ADR (ABB) | |||
|---|---|---|---|
| 37.13 0 (0%) | 05-22 16:00 | ||
| Open: | 37.51 | Pre. Close: | 37.56 |
| High: | 37.57 | Low: | 37.12 |
| Volume: | 6,388,230 | Market Cap: | 69,021(M) |
| Stock Technical Analysis | |
|---|---|
| Overall: |  |
| Target: | Six months: 47.23 One year: 55.17 |
| Support: | Support1: 38.50 Support2: 37.30 |
| Resistance: | Resistance1: 40.44 Resistance2: 47.23 |
| Pivot: | 38.88 |
| Moving Averages: | MA(5): 39.56 MA(20): 38.79 MA(100): 36.14 MA(250): 32.48 |
| MACD: | MACD(12,26): 0.48 Signal(12,26,9): 0.38 |
| %K %D: | %K(14,3): 82.35 %D(3): 82.00 |
| RSI: | RSI(14): 63.60 |
| 52-Week: | High: 37.76 Low: 24.27 Change(%): 40.7 |
| Average Vol(K): | 3-Month: 938 10-Days: 250 |
| Prices Prediction (Update @5:00pm) | ||
|---|---|---|
| If tomorrow: | Open lower | Open higher |
| High: | 40.493 - 40.656 | 40.656 - 40.812 |
| Low: | 39.727 - 39.911 | 39.911 - 40.087 |
| Close: | 39.88 - 40.164 | 40.164 - 40.435 |
| Price, MAs and Bollinger Bands |
|---|
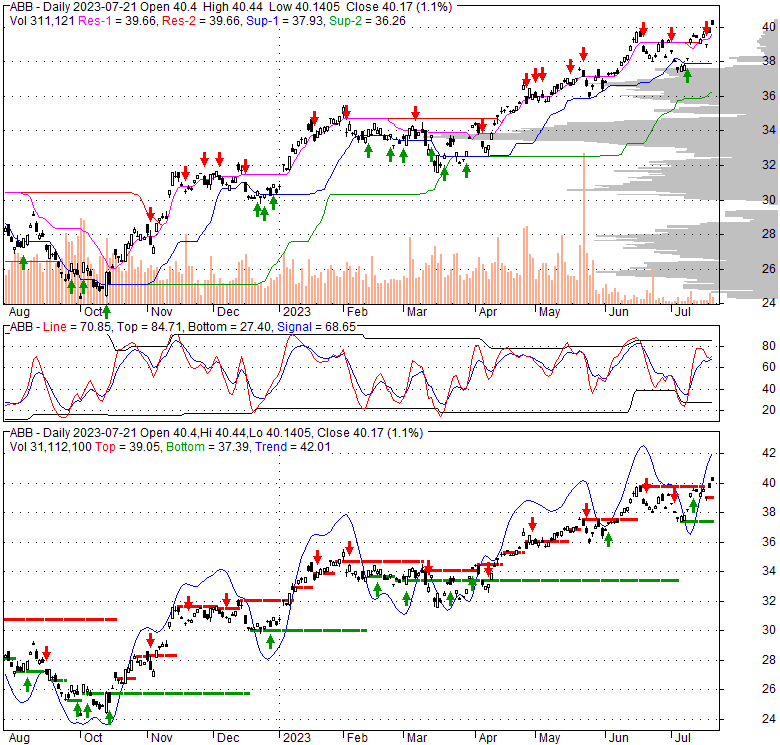
| Price has closed above its short-term moving average. Short-term moving average is currently above mid-term; and above long-term moving average. From the relationship between price and moving averages: This stock is BULLISH in short-term; and BULLISH in mid-long term.[ ABB ] has closed below upper band by 9.6%. Bollinger Bands are 33.5% wider than normal. The current width of the bands does not suggest anything about the future direction or movement of prices. |
| Company profile |
|---|
| ABB Ltd engages in manufacture and sale of electrification, automation, robotics, and motion products for customers in utilities, industry and transport, and infrastructure in Switzerland and internationally. Its Electrification segment provides electric vehicle charging infrastructure, renewable power solutions, modular substation packages, distribution automation products, switchboard and panelboards, switchgear, UPS solutions, circuit breakers, measuring and sensing devices, control products, wiring accessories, enclosures and cabling systems, and intelligent home and building solutions. The company's Robotics & Discrete Automation segment offers industrial robots, software, robotic solutions and systems, field services, spare parts, and digital services. This segment also offers solutions based on its programmable logic controllers, industrial PCs, servo motion, transport system, and machine vision. Its Motion segment manufactures and sells drives, motors, generators, traction converters, and mechanical power transmission products that are driving the low-carbon future for industries, cities, infrastructure, and transportation. The company's Process Automation segment provides process and discrete control technologies, advanced process control software and manufacturing execution systems, sensing, measurement and analytical instrumentation, marine propulsion systems, and large turbochargers. In addition, this segment offers remote monitoring, preventive maintenance, asset performance management, emission monitoring, and cybersecurity services. It serves aluminum, automotive, buildings and infrastructure, cement, channel partners, chemical, data centers, food and beverage, process automation, life sciences, marine and ports, metals, mining, oil and gas, ports, power generation, printing, pulp and paper, railway, smart cities, water, and wind power industries. The company was founded in 1883 and is headquartered in Zurich, Switzerland. |
| Stock chart |
|---|
 |
| Financial Analysis | |
|---|---|
| Price to Book Value: | Outperform |
| P/BV, a ratio used to compare book value to its current market price, to gauge whether a stock is valued properly. | |
| Price to Earnings: | Outperform |
| PE, the ratio for valuing a company that measures its current share price relative to its earnings per share (EPS). | |
| Discounted cash flow: | Outperform |
| DCF, a valuation method used to estimate the value of an investment based on its expected future cash flows. | |
| Return on Assets: | Outperform |
| ROA, indicates how profitable a company is in relation to its total assets, how efficiently uses assets to generate a profit. | |
| Return on Equity: | Outperform |
| ROE, a measure of financial performance calculated by dividing net income by equity. a gauge of profitability and efficiency. | |
| Debt to Equity: | Outperform |
| evaluate financial leverage, reflects the ability of equity to cover outstanding debts in the event of a business downturn. | |
| Stock Basics & Statistics | |
|---|---|
| Exchange: New York Stock Exchange | |
| Sector: Industrials | |
| Industry: Electrical Equipment & Parts | |
| Shares Out. (M) | 1860.00 |
| Shares Float (M) | 6410.00 |
| % Held by Insiders | |
| % Held by Institutions | 6.01 |
| Shares Short (K) | 2320 |
| Shares Short Prior Month (K) | 1710 |
| Stock Financials | |
|---|---|
| EPS | 1.570 |
| Book Value (p.s.) | 1.640 |
| Profit Margin | 9.58 |
| Operating Margin | 13.24 |
| Return on Assets (ttm) | 6.1 |
| Return on Equity (ttm) | 23.0 |
| Qtrly Rev. Growth | 12.8 |
| Gross Profit (p.s.) | 5.231 |
| Sales Per Share | 16.312 |
| EBITDA (p.s.) | 2.559 |
| Qtrly Earnings Growth | 78.40 |
| Operating Cash Flow (M) | 2140.00 |
| Levered Free Cash Flow (M) | 743.88 |
| Stock Valuation | |
|---|---|
| PE Ratio | 25.59 |
| PEG Ratio | 1.36 |
| Price to Book value | 24.49 |
| Price to Sales | 2.46 |
| Price to Cash Flow | 34.91 |
| Stock Dividends | |
|---|---|
| Dividend | 0.920 |
| Dividend Yield | 0.02 |
| Dividend Growth | |