| Affimed N.V. (AFMD) | |||
|---|---|---|---|
| 5.15 0.08 (1.58%) | 04-19 16:00 | ||
| Open: | 5.13 | Pre. Close: | 5.07 |
| High: | 5.21 | Low: | 5.0004 |
| Volume: | 63,710 | Market Cap: | 78(M) |
| Stock Technical Analysis | |
|---|---|
| Overall: |  |
| Target: | Six months: 7.16 One year: 8.46 |
| Support: | Support1: 4.33 Support2: 3.60 |
| Resistance: | Resistance1: 6.13 Resistance2: 7.24 |
| Pivot: | 5.91 |
| Moving Averages: | MA(5): 5.26 MA(20): 5.74 MA(100): 5.42 MA(250): 5.74 |
| MACD: | MACD(12,26): -0.08 Signal(12,26,9): 0.04 |
| %K %D: | %K(14,3): 4.10 %D(3): 8.24 |
| RSI: | RSI(14): 40.79 |
| 52-Week: | High: 11.1 Low: 2.24 Change(%): -39.4 |
| Average Vol(K): | 3-Month: 94 10-Days: 73 |
| Prices Prediction (Update @5:00pm) | ||
|---|---|---|
| If tomorrow: | Open lower | Open higher |
| High: | 5.222 - 5.257 | 5.257 - 5.288 |
| Low: | 4.916 - 4.959 | 4.959 - 4.999 |
| Close: | 5.082 - 5.151 | 5.151 - 5.214 |
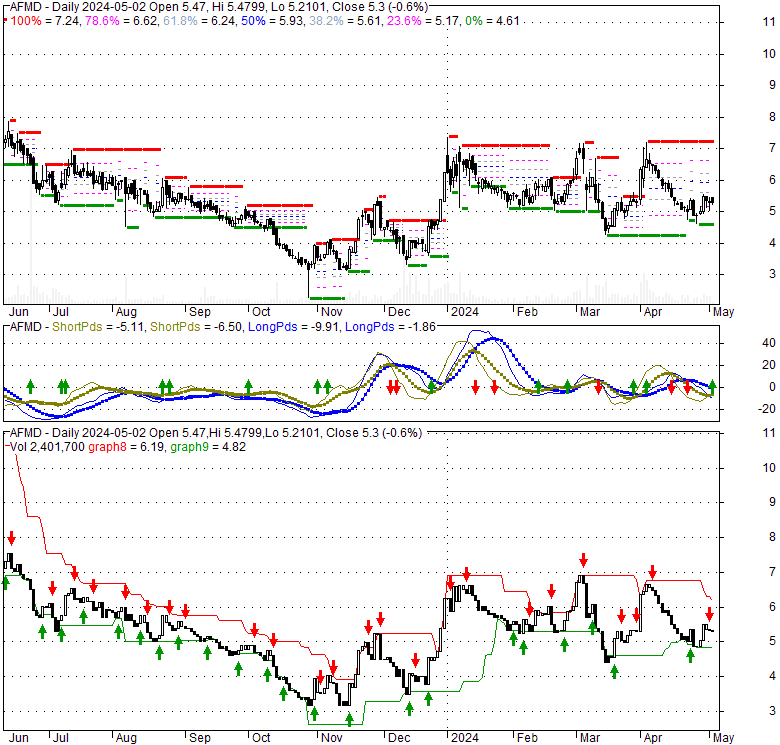
| Price, MAs and Bollinger Bands |
|---|
| Price has closed below its short-term moving average. Short-term moving average is currently below mid-term; and below long-term moving average. From the relationship between price and moving averages: This stock is BEARISH in short-term; and NEUTRAL in mid-long term.[ AFMD ] has closed above bottom band by 14.0%. Bollinger Bands are 7.1% wider than normal. The current width of the bands does not suggest anything about the future direction or movement of prices. |
| Company profile |
|---|
| Affimed N.V., a clinical-stage biopharmaceutical company, focuses on discovering and developing cancer immunotherapies in the United States, Germany, and rest of Europe. Its lead product candidate is AFM13, which has completed Phase II clinical study for peripheral T-cell lymphoma; in Phase IIa clinical trial for CD30-positive lymphoma; and in Phase I clinical trial for hodgkin lymphoma. The company is also developing AFM24, a tetravalent, bispecific epidermal growth factor receptor, and CD16A-binding innate cell engager, which is in Phase IIa clinical trial for the treatment of advanced cancers; AFM28, an innate cell engager (ICE), which is in preclinical development to treat acute myeloid leukemia; and AFM32, an ICE candidate that is in preclinical development for the treatment of solid tumors. Affimed N.V. has collaboration agreements with The University of Texas MD Anderson Cancer Center; Genentech, Inc.; and Roivant Sciences Ltd., as well as research funding agreement with The Leukemia & Lymphoma Society. The company was formerly known as Affimed Therapeutics B.V. and changed its name to Affimed N.V. in October 2014. Affimed N.V. was founded in 2000 and is headquartered in Heidelberg, Germany. |
| Stock chart |
|---|
 |
| Financial Analysis | |
|---|---|
| Price to Book Value: | Neutral |
| P/BV, a ratio used to compare book value to its current market price, to gauge whether a stock is valued properly. | |
| Price to Earnings: | Neutral |
| PE, the ratio for valuing a company that measures its current share price relative to its earnings per share (EPS). | |
| Discounted cash flow: | Underperform |
| DCF, a valuation method used to estimate the value of an investment based on its expected future cash flows. | |
| Return on Assets: | Underperform |
| ROA, indicates how profitable a company is in relation to its total assets, how efficiently uses assets to generate a profit. | |
| Return on Equity: | Underperform |
| ROE, a measure of financial performance calculated by dividing net income by equity. a gauge of profitability and efficiency. | |
| Debt to Equity: | Outperform |
| evaluate financial leverage, reflects the ability of equity to cover outstanding debts in the event of a business downturn. | |
| Stock Basics & Statistics | |
|---|---|
| Exchange: NASDAQ Global Market | |
| Sector: Healthcare | |
| Industry: Biotechnology | |
| Shares Out. (M) | 15.23 |
| Shares Float (M) | 13.50 |
| % Held by Insiders | 6.01 |
| % Held by Institutions | 35.86 |
| Shares Short (K) | 196 |
| Shares Short Prior Month (K) | 155 |
| Stock Financials | |
|---|---|
| EPS | -7.620 |
| Book Value (p.s.) | 3.850 |
| Profit Margin | |
| Operating Margin | -382.46 |
| Return on Assets (ttm) | -43.5 |
| Return on Equity (ttm) | -100.6 |
| Qtrly Rev. Growth | -58.3 |
| Gross Profit (p.s.) | |
| Sales Per Share | 0.913 |
| EBITDA (p.s.) | -6.736 |
| Qtrly Earnings Growth | |
| Operating Cash Flow (M) | -110.27 |
| Levered Free Cash Flow (M) | -105.80 |
| Stock Valuation | |
|---|---|
| PE Ratio | -0.68 |
| PEG Ratio | |
| Price to Book value | 1.34 |
| Price to Sales | 5.64 |
| Price to Cash Flow | -0.71 |
| Stock Dividends | |
|---|---|
| Dividend | |
| Dividend Yield | |
| Dividend Growth | |


