| Amarin Corp ADR (AMRN) | |||
|---|---|---|---|
| 0.8786 -0.005 (-0.53%) | 04-24 16:00 | ||
| Open: | 0.88 | Pre. Close: | 0.8833 |
| High: | 0.889 | Low: | 0.8655 |
| Volume: | 657,214 | Market Cap: | 359(M) |
| Stock Technical Analysis | |
|---|---|
| Overall: |  |
| Target: | Six months: 1.17 One year: 1.30 |
| Support: | Support1: 0.83 Support2: 0.69 |
| Resistance: | Resistance1: Resistance2: 1.11 |
| Pivot: | 0.96 |
| Moving Averages: | MA(5): 0.87 MA(20): 0.95 MA(100): MA(250): 1.03 |
| MACD: | MACD(12,26): -0.03 Signal(12,26,9): -0.02 |
| %K %D: | %K(14,3): 7.77 %D(3): 6.65 |
| RSI: | RSI(14): 40.86 |
| 52-Week: | High: 1.49 Low: 0.65 Change(%): -30.3 |
| Average Vol(K): | 3-Month: 1587 10-Days: 810 |
| Prices Prediction (Update @5:00pm) | ||
|---|---|---|
| If tomorrow: | Open lower | Open higher |
| High: | 0.891 - 0.896 | 0.896 - 0.901 |
| Low: | 0.858 - 0.864 | 0.864 - 0.869 |
| Close: | 0.872 - 0.881 | 0.881 - 0.889 |
| Price, MAs and Bollinger Bands |
|---|
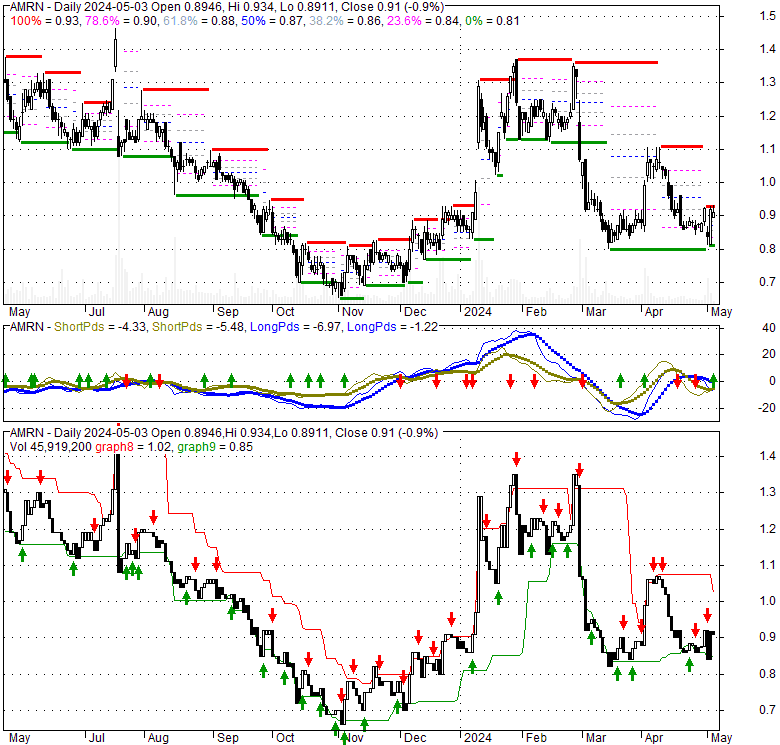
| Price has closed above its short-term moving average. Short-term moving average is currently below mid-term; and below long-term moving average. From the relationship between price and moving averages: This stock is NEUTRAL in short-term; and BEARISH in mid-long term.[ AMRN ] has closed above bottom band by 25.5%. Bollinger Bands are 6.9% wider than normal. The current width of the bands does not suggest anything about the future direction or movement of prices. |
| Company profile |
|---|
| Amarin Corporation plc, a pharmaceutical company, engages in the development and commercialization of therapeutics for the treatment of cardiovascular diseases in the United States, Germany, Canada, Lebanon, and the United Arab Emirates. Its lead product is VASCEPA, a prescription-only omega-3 fatty acid product, used as an adjunct to diet for reducing triglyceride levels in adult patients with severe hypertriglyceridemia. The company sells its products principally to wholesalers and specialty pharmacy providers. It has a collaboration with Mochida Pharmaceutical Co., Ltd. to develop and commercialize drug products and indications based on the active pharmaceutical ingredient in Vascepa, the omega-3 acid, and eicosapentaenoic acid. The company was formerly known as Ethical Holdings plc and changed its name to Amarin Corporation plc in 1999. Amarin Corporation plc was incorporated in 1989 and is headquartered in Dublin, Ireland. |
| Stock chart |
|---|
 |
| Financial Analysis | |
|---|---|
| Price to Book Value: | Underperform |
| P/BV, a ratio used to compare book value to its current market price, to gauge whether a stock is valued properly. | |
| Price to Earnings: | Underperform |
| PE, the ratio for valuing a company that measures its current share price relative to its earnings per share (EPS). | |
| Discounted cash flow: | Underperform |
| DCF, a valuation method used to estimate the value of an investment based on its expected future cash flows. | |
| Return on Assets: | Neutral |
| ROA, indicates how profitable a company is in relation to its total assets, how efficiently uses assets to generate a profit. | |
| Return on Equity: | Underperform |
| ROE, a measure of financial performance calculated by dividing net income by equity. a gauge of profitability and efficiency. | |
| Debt to Equity: | Neutral |
| evaluate financial leverage, reflects the ability of equity to cover outstanding debts in the event of a business downturn. | |
| Stock Basics & Statistics | |
|---|---|
| Exchange: NASDAQ Global Market | |
| Sector: Healthcare | |
| Industry: Biotechnology | |
| Shares Out. (M) | 401.36 |
| Shares Float (M) | 383.11 |
| % Held by Insiders | 1.54 |
| % Held by Institutions | 23.79 |
| Shares Short (K) | 18020 |
| Shares Short Prior Month (K) | 16990 |
| Stock Financials | |
|---|---|
| EPS | -0.150 |
| Book Value (p.s.) | 1.350 |
| Profit Margin | -19.26 |
| Operating Margin | -6.17 |
| Return on Assets (ttm) | -1.3 |
| Return on Equity (ttm) | -10.3 |
| Qtrly Rev. Growth | -17.2 |
| Gross Profit (p.s.) | |
| Sales Per Share | 0.765 |
| EBITDA (p.s.) | -0.036 |
| Qtrly Earnings Growth | |
| Operating Cash Flow (M) | 6.88 |
| Levered Free Cash Flow (M) | -19.45 |
| Stock Valuation | |
|---|---|
| PE Ratio | -5.86 |
| PEG Ratio | -0.16 |
| Price to Book value | 0.65 |
| Price to Sales | 1.15 |
| Price to Cash Flow | 51.26 |
| Stock Dividends | |
|---|---|
| Dividend | |
| Dividend Yield | |
| Dividend Growth | |