| American Well Corp Cl A (AMWL) | |||
|---|---|---|---|
| 0.5583 0.016 (2.89%) | 04-24 12:18 | ||
| Open: | 0.54 | Pre. Close: | 0.5426 |
| High: | 0.5591 | Low: | 0.5346 |
| Volume: | 1,064,504 | Market Cap: | 165(M) |
| Stock Technical Analysis | |
|---|---|
| Overall: |  |
| Target: | Six months: 0.90 One year: 1.10 |
| Support: | Support1: 0.50 Support2: 0.42 |
| Resistance: | Resistance1: 0.77 Resistance2: 0.94 |
| Pivot: | 0.61 |
| Moving Averages: | MA(5): 0.54 MA(20): 0.65 MA(100): 1.05 MA(250): 1.44 |
| MACD: | MACD(12,26): -0.10 Signal(12,26,9): -0.10 |
| %K %D: | %K(14,3): 13.06 %D(3): 12.18 |
| RSI: | RSI(14): 27.67 |
| 52-Week: | High: 2.735 Low: 0.501 Change(%): -72.6 |
| Average Vol(K): | 3-Month: 2198 10-Days: 2971 |
| Prices Prediction (Update @5:00pm) | ||
|---|---|---|
| If tomorrow: | Open lower | Open higher |
| High: | 0.58 - 0.583 | 0.583 - 0.586 |
| Low: | 0.533 - 0.536 | 0.536 - 0.539 |
| Close: | 0.535 - 0.54 | 0.54 - 0.544 |
| Price, MAs and Bollinger Bands |
|---|
| Price has closed above its short-term moving average. Short-term moving average is currently below mid-term; and below long-term moving average. From the relationship between price and moving averages: This stock is NEUTRAL in short-term; and BEARISH in mid-long term.[ AMWL ] has closed above bottom band by 33.4%. Bollinger Bands are 12.1% wider than normal. The current width of the bands does not suggest anything about the future direction or movement of prices. |
| Company profile |
|---|
| American Well Corporation operates as a telehealth software company that enables digital delivery of care for healthcare. The company products offer urgent care; scheduled visits; acute behavioral health; telestroke; pediatrics; retail health, school health, and home settings. Its application offers urgent care; pediatrics; therapy; menopause nutrition; end-stage renal disease and dialysis; dermatology care; behavioral health therapy; and musculoskeletal care. The company also provides telemedicine equipment, including telemedicine carts, peripherals, tyto care, TV kits, tablets, and kiosks. American Well Corporation was incorporated in 2006 and is headquartered in Boston, Massachusetts. |
| Stock chart |
|---|
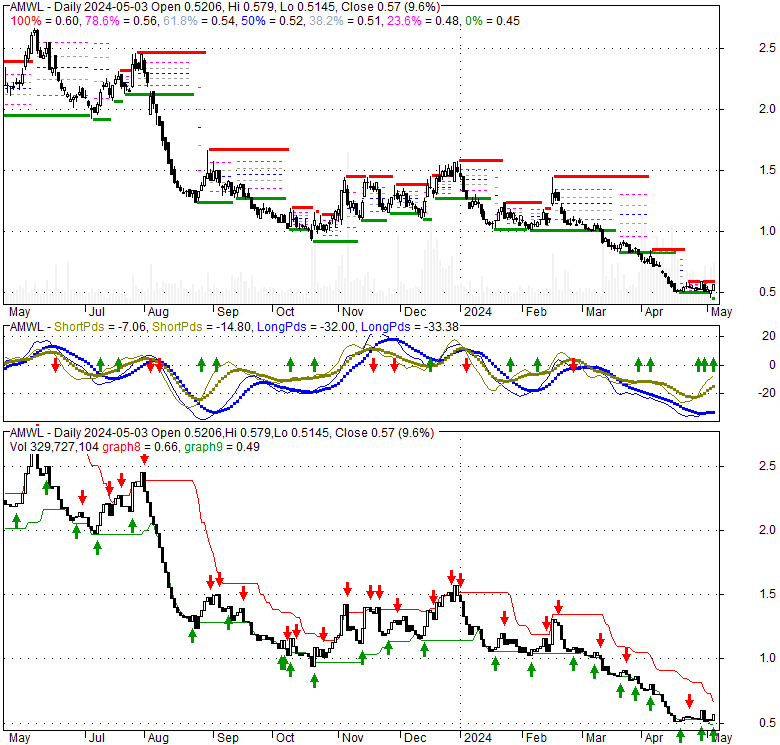 |
| Financial Analysis | |
|---|---|
| Price to Book Value: | Underperform |
| P/BV, a ratio used to compare book value to its current market price, to gauge whether a stock is valued properly. | |
| Price to Earnings: | Underperform |
| PE, the ratio for valuing a company that measures its current share price relative to its earnings per share (EPS). | |
| Discounted cash flow: | Neutral |
| DCF, a valuation method used to estimate the value of an investment based on its expected future cash flows. | |
| Return on Assets: | Underperform |
| ROA, indicates how profitable a company is in relation to its total assets, how efficiently uses assets to generate a profit. | |
| Return on Equity: | Underperform |
| ROE, a measure of financial performance calculated by dividing net income by equity. a gauge of profitability and efficiency. | |
| Debt to Equity: | Neutral |
| evaluate financial leverage, reflects the ability of equity to cover outstanding debts in the event of a business downturn. | |
| Stock Basics & Statistics | |
|---|---|
| Exchange: New York Stock Exchange | |
| Sector: Healthcare | |
| Industry: Medical - Healthcare Information Services | |
| Shares Out. (M) | 256.31 |
| Shares Float (M) | 202.77 |
| % Held by Insiders | 7.47 |
| % Held by Institutions | 58.09 |
| Shares Short (K) | 6170 |
| Shares Short Prior Month (K) | 4370 |
| Stock Financials | |
|---|---|
| EPS | -2.380 |
| Book Value (p.s.) | 1.610 |
| Profit Margin | -260.63 |
| Operating Margin | -74.34 |
| Return on Assets (ttm) | -17.4 |
| Return on Equity (ttm) | -86.8 |
| Qtrly Rev. Growth | -10.8 |
| Gross Profit (p.s.) | |
| Sales Per Share | 1.011 |
| EBITDA (p.s.) | -0.882 |
| Qtrly Earnings Growth | |
| Operating Cash Flow (M) | -148.34 |
| Levered Free Cash Flow (M) | -76.08 |
| Stock Valuation | |
|---|---|
| PE Ratio | -0.23 |
| PEG Ratio | -0.02 |
| Price to Book value | 0.34 |
| Price to Sales | 0.54 |
| Price to Cash Flow | -0.95 |
| Stock Dividends | |
|---|---|
| Dividend | |
| Dividend Yield | |
| Dividend Growth | |


