| America Movil S.A.B. DE C.V. ADR (AMX) | |||
|---|---|---|---|
| 18.025 0.275 (1.55%) | 04-19 13:31 | ||
| Open: | 17.58 | Pre. Close: | 17.75 |
| High: | 18.075 | Low: | 17.57 |
| Volume: | 695,458 | Market Cap: | 56,044(M) |
| Stock Technical Analysis | |
|---|---|
| Overall: |  |
| Target: | Six months: 21.99 One year: 22.90 |
| Support: | Support1: 17.56 Support2: 14.61 |
| Resistance: | Resistance1: 18.83 Resistance2: 19.61 |
| Pivot: | 18.42 |
| Moving Averages: | MA(5): 17.88 MA(20): 18.44 MA(100): 18.41 MA(250): 19.15 |
| MACD: | MACD(12,26): -0.21 Signal(12,26,9): -0.10 |
| %K %D: | %K(14,3): 11.94 %D(3): 8.01 |
| RSI: | RSI(14): 39.46 |
| 52-Week: | High: 23.07 Low: 16 Change(%): -16.6 |
| Average Vol(K): | 3-Month: 1399 10-Days: 1080 |
| Prices Prediction (Update @5:00pm) | ||
|---|---|---|
| If tomorrow: | Open lower | Open higher |
| High: | 18.419 - 18.53 | 18.53 - 18.636 |
| Low: | 17.422 - 17.551 | 17.551 - 17.673 |
| Close: | 17.832 - 18.022 | 18.022 - 18.205 |
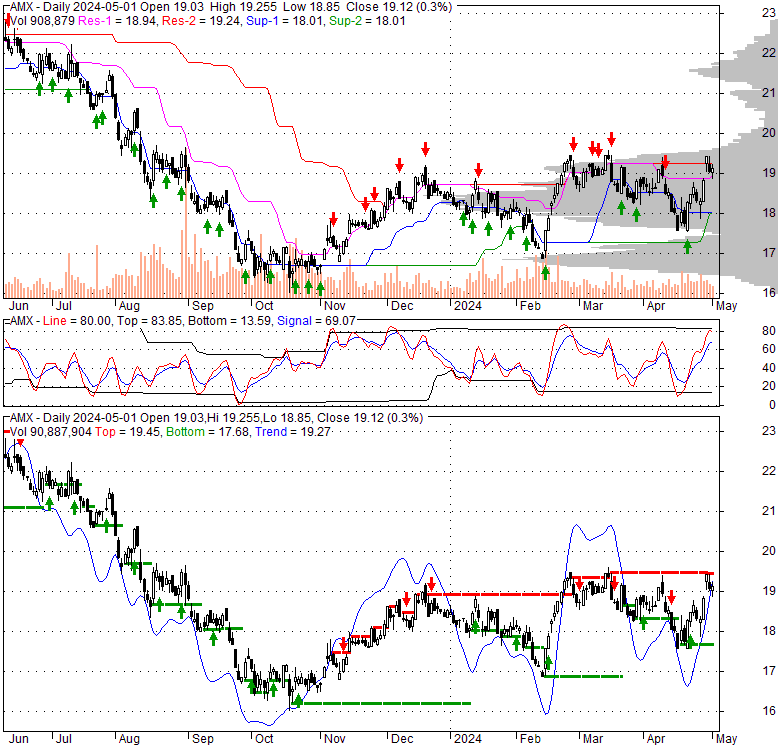
| Price, MAs and Bollinger Bands |
|---|
| Price has closed below its short-term moving average. Short-term moving average is currently below mid-term; and below long-term moving average. From the relationship between price and moving averages: This stock is BEARISH in short-term; and NEUTRAL in mid-long term.[ AMX ] has closed above bottom band by 10.2%. Bollinger Bands are 29.8% wider than normal. The current width of the bands does not suggest anything about the future direction or movement of prices. |
| Company profile |
|---|
| América Móvil, S.A.B. de C.V. provides telecommunications services in Latin America and internationally. The company offers wireless and fixed voice services, including local, domestic, and international long-distance services; and network interconnection services. It also provides data services, such as data centers, data administration, and hosting services to residential and corporate clients; value-added services, including Internet access, messaging, and other wireless entertainment and corporate services; data transmission, email services, instant messaging, content streaming, and interactive applications; and wireless security services, mobile payment solutions, machine-to-machine services, mobile banking, virtual private network services, and video calls and personal communications services. In addition, the company offers residential broadband services; IT solutions for small businesses and large corporations; and cable and satellite pay television subscriptions. Further, it sells equipment, accessories, and computers; and offers telephone directories, wireless security, call center, advertising, media, and software development services. Additionally, the company provides video, audio, and other media content through the Internet directly from the content provider to the end user. It sells its products and services under the Telcel, Telmex Infinitum, and A1 brands through a network of retailers and service centers to retail customers; and through sales force to corporate customers. As of December 31, 2021, the company had approximately 286.5 million wireless voice and data subscribers. América Móvil, S.A.B. de C.V. was incorporated in 2000 and is based in Mexico City, Mexico. |
| Stock chart |
|---|
 |
| Stock News |
|---|
|
Wed, 17 Apr 2024 América Móvil, S.A.B. de C.V. (AMX) Q1 2024 Earnings Call Transcript - Seeking Alpha Wed, 17 Apr 2024 America Movil's (AMX) Q1 Earnings & Revenues Decrease Y/Y - Yahoo Finance Sat, 13 Apr 2024 Here's Why Amer Movil (AMX) is a Strong Value Stock - Yahoo Movies Canada Thu, 14 Mar 2024 Why Is Amer Movil (AMX) Up 10.8% Since Last Earnings Report? - Yahoo Finance Sat, 02 Mar 2024 AMX Stock Quote Price and Forecast - CNN Wed, 21 Feb 2024 AMX: 3 Telecom Stocks With Explosive Potential - StockNews.com |
| Financial Analysis | |
|---|---|
| Price to Book Value: | Outperform |
| P/BV, a ratio used to compare book value to its current market price, to gauge whether a stock is valued properly. | |
| Price to Earnings: | Outperform |
| PE, the ratio for valuing a company that measures its current share price relative to its earnings per share (EPS). | |
| Discounted cash flow: | Underperform |
| DCF, a valuation method used to estimate the value of an investment based on its expected future cash flows. | |
| Return on Assets: | Outperform |
| ROA, indicates how profitable a company is in relation to its total assets, how efficiently uses assets to generate a profit. | |
| Return on Equity: | Outperform |
| ROE, a measure of financial performance calculated by dividing net income by equity. a gauge of profitability and efficiency. | |
| Debt to Equity: | Outperform |
| evaluate financial leverage, reflects the ability of equity to cover outstanding debts in the event of a business downturn. | |
| Stock Basics & Statistics | |
|---|---|
| Exchange: New York Stock Exchange | |
| Sector: Communication Services | |
| Industry: Telecommunications Services | |
| Shares Out. (M) | 3100.00 |
| Shares Float (M) | 19970.00 |
| % Held by Insiders | |
| % Held by Institutions | 6.49 |
| Shares Short (K) | 5790 |
| Shares Short Prior Month (K) | 5240 |
| Stock Financials | |
|---|---|
| EPS | 1.480 |
| Book Value (p.s.) | 5.870 |
| Profit Margin | 9.33 |
| Operating Margin | 20.83 |
| Return on Assets (ttm) | 6.6 |
| Return on Equity (ttm) | 18.8 |
| Qtrly Rev. Growth | |
| Gross Profit (p.s.) | |
| Sales Per Share | 263.229 |
| EBITDA (p.s.) | 103.087 |
| Qtrly Earnings Growth | 37.20 |
| Operating Cash Flow (M) | 238710.00 |
| Levered Free Cash Flow (M) | -51760.00 |
| Stock Valuation | |
|---|---|
| PE Ratio | 11.99 |
| PEG Ratio | 1.67 |
| Price to Book value | 3.02 |
| Price to Sales | 0.07 |
| Price to Cash Flow | 0.23 |
| Stock Dividends | |
|---|---|
| Dividend | |
| Dividend Yield | |
| Dividend Growth | |


