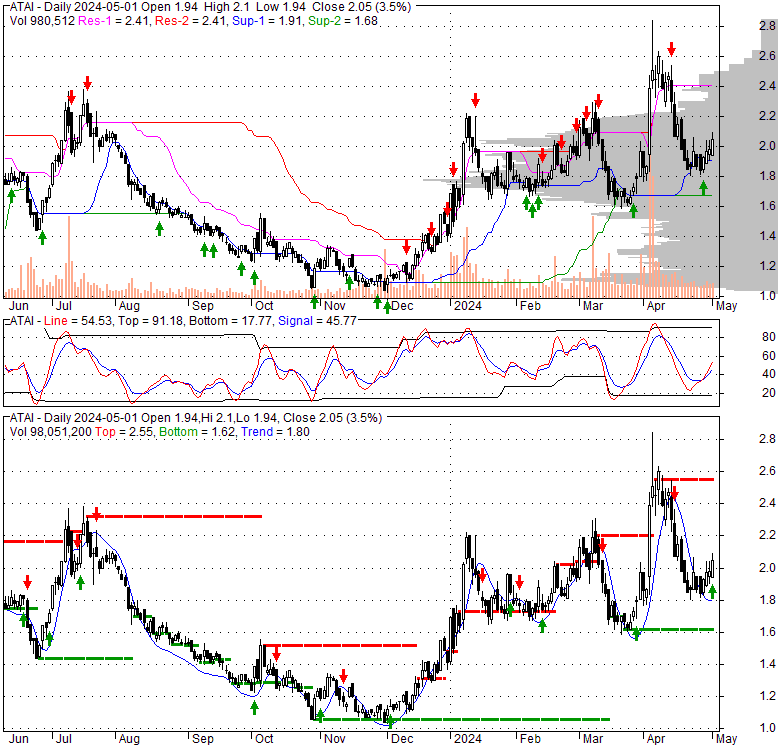
| Atai Life Sciences N.V. (ATAI) | |||
|---|---|---|---|
| 1.89 -0.02 (-1.05%) | 04-19 12:27 | ||
| Open: | 1.92 | Pre. Close: | 1.91 |
| High: | 1.98 | Low: | 1.88 |
| Volume: | 462,043 | Market Cap: | 314(M) |
| Stock Technical Analysis | |
|---|---|
| Overall: |  |
| Target: | Six months: 2.76 One year: 3.33 |
| Support: | Support1: 1.58 Support2: 1.31 |
| Resistance: | Resistance1: 2.36 Resistance2: 2.85 |
| Pivot: | 2.22 |
| Moving Averages: | MA(5): 2.08 MA(20): 2.09 MA(100): 1.75 MA(250): 1.68 |
| MACD: | MACD(12,26): 0.06 Signal(12,26,9): 0.10 |
| %K %D: | %K(14,3): 26.69 %D(3): 35.25 |
| RSI: | RSI(14): 44.40 |
| 52-Week: | High: 2.85 Low: 1.025 Change(%): -12.8 |
| Average Vol(K): | 3-Month: 1656 10-Days: 1622 |
| Prices Prediction (Update @5:00pm) | ||
|---|---|---|
| If tomorrow: | Open lower | Open higher |
| High: | 2.203 - 2.213 | 2.213 - 2.224 |
| Low: | 1.951 - 1.963 | 1.963 - 1.976 |
| Close: | 1.957 - 1.977 | 1.977 - 1.996 |
| Price, MAs and Bollinger Bands |
|---|
| Price has closed below its short-term moving average. Short-term moving average is currently above mid-term; and above long-term moving average. From the relationship between price and moving averages: This stock is NEUTRAL in short-term; and BULLISH in mid-long term.[ ATAI ] has closed above bottom band by 18.8%. Bollinger Bands are 81.4% wider than normal. The large width of the bands suggest high volatility as compared to its normal range. The bands have been in this wide range for 11 days. This is a sign that the current trend might continue. |
| Company profile |
|---|
| Atai Life Sciences N.V., through its subsidiary, ATAI Life Sciences AG, operates as a clinical-stage biopharmaceutical company. It engages in developing various therapeutic candidates that focuses on various mental health disorders. The company's therapeutic candidates include PCN-101, a subcutaneous formulation of R-ketamine for the treatment of treatment-resistant depression (TRD); RL-007, a cholinergic, glutamatergic, and GABA-B receptor modulator to treat cognitive impairment associated with schizophrenia; DMX-1002, an oral formulation of ibogaine for treating opioid use disorder (OUD); GRX-917, an oral formulation of a deuterated version of etifoxine for the generalized anxiety disorder treatment; and NN-101, a novel intranasal formulation of N-acetylcysteine to treat mild traumatic brain injuries. Its therapeutic candidates also comprise VLS-01, a formulation of N,N-dimethyltryptamine for treating TRD; EMP-01, an oral formulation of an 3,4-methyl enedioxy methamphetamine for the treatment of post-traumatic stress disorder; RLS-01, a formulation of Salvinorin A for TRD; KUR-101, an oral formulation of deuterated mitragynine to treat OUD; and DMX-1001, an oral formulation of noribogaine for the treatment of OUD. The company was formerly known as Adripa Holding B.V. Atai Life Sciences N.V. was founded in 2018 and is headquartered in Berlin, Germany. |
| Stock chart |
|---|
 |
| Financial Analysis | |
|---|---|
| Price to Book Value: | Neutral |
| P/BV, a ratio used to compare book value to its current market price, to gauge whether a stock is valued properly. | |
| Price to Earnings: | Underperform |
| PE, the ratio for valuing a company that measures its current share price relative to its earnings per share (EPS). | |
| Discounted cash flow: | Neutral |
| DCF, a valuation method used to estimate the value of an investment based on its expected future cash flows. | |
| Return on Assets: | Underperform |
| ROA, indicates how profitable a company is in relation to its total assets, how efficiently uses assets to generate a profit. | |
| Return on Equity: | Underperform |
| ROE, a measure of financial performance calculated by dividing net income by equity. a gauge of profitability and efficiency. | |
| Debt to Equity: | Neutral |
| evaluate financial leverage, reflects the ability of equity to cover outstanding debts in the event of a business downturn. | |
| Stock Basics & Statistics | |
|---|---|
| Exchange: NASDAQ Global Market | |
| Sector: Healthcare | |
| Industry: Biotechnology | |
| Shares Out. (M) | |
| Shares Float (M) | 166.03 |
| % Held by Insiders | 126680000.00 |
| % Held by Institutions | 9.99 |
| Shares Short (K) | 3530 |
| Shares Short Prior Month (K) | |
| Stock Financials | |
|---|---|
| EPS | -121950000.000 |
| Book Value (p.s.) | |
| Profit Margin | |
| Operating Margin | -186.00 |
| Return on Assets (ttm) | 483.3 |
| Return on Equity (ttm) | -25.5 |
| Qtrly Rev. Growth | 314000.0 |
| Gross Profit (p.s.) | -53.673 |
| Sales Per Share | -17.561 |
| EBITDA (p.s.) | |
| Qtrly Earnings Growth | -0.25 |
| Operating Cash Flow (M) | |
| Levered Free Cash Flow (M) | -84.12 |
| Stock Valuation | |
|---|---|
| PE Ratio | |
| PEG Ratio | |
| Price to Book value | |
| Price to Sales | -0.11 |
| Price to Cash Flow | 1.28 |
| Stock Dividends | |
|---|---|
| Dividend | |
| Dividend Yield | |
| Dividend Growth | 5550000.000 |