| American Express Company (AXP) | |||
|---|---|---|---|
| 217.5 -0.17 (-0.08%) | 04-18 16:00 | ||
| Open: | 218.26 | Pre. Close: | 217.67 |
| High: | 221.445 | Low: | 217.175 |
| Volume: | 3,877,733 | Market Cap: | 157,442(M) |
| Stock Technical Analysis | |
|---|---|
| Overall: |  |
| Target: | Six months: 262.95 One year: 270.61 |
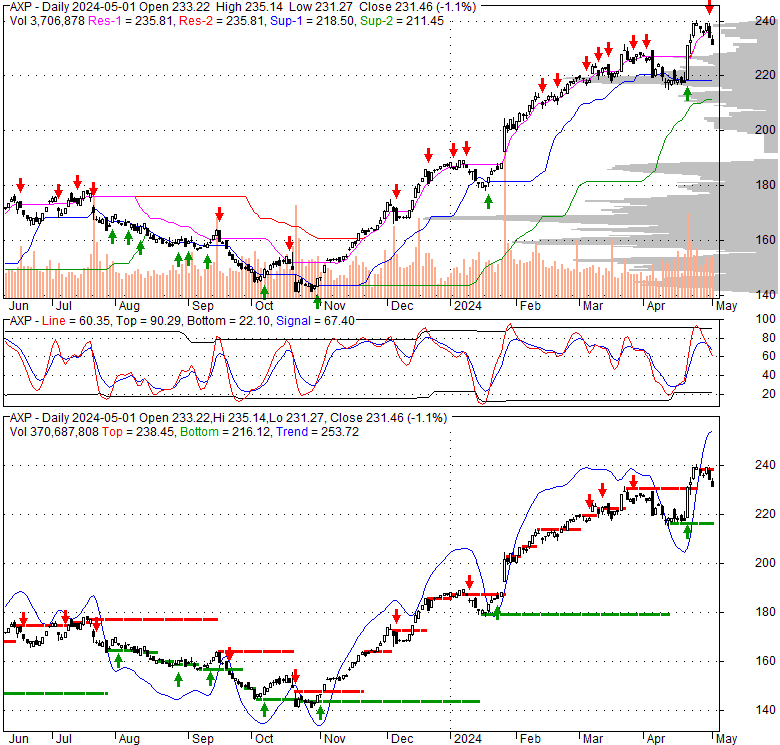
| Support: | Support1: 214.51 Support2: 178.47 |
| Resistance: | Resistance1: 225.13 Resistance2: 231.69 |
| Pivot: | 221.29 |
| Moving Averages: | MA(5): 218.02 MA(20): 222.64 MA(100): 201.36 MA(250): 176.32 |
| MACD: | MACD(12,26): -0.49 Signal(12,26,9): 0.65 |
| %K %D: | %K(14,3): 21.93 %D(3): 23.49 |
| RSI: | RSI(14): 43.54 |
| 52-Week: | High: 231.69 Low: 140.91 Change(%): 33.2 |
| Average Vol(K): | 3-Month: 3104 10-Days: 2831 |
| Prices Prediction (Update @5:00pm) | ||
|---|---|---|
| If tomorrow: | Open lower | Open higher |
| High: | 221.694 - 223.499 | 223.499 - 224.712 |
| Low: | 213.416 - 215.417 | 215.417 - 216.761 |
| Close: | 214.897 - 217.977 | 217.977 - 220.045 |
| Price, MAs and Bollinger Bands |
|---|
| Price has closed below its short-term moving average. Short-term moving average is currently below mid-term; and above long-term moving average. From the relationship between price and moving averages: This stock is BEARISH in short-term; and NEUTRAL in mid-long term.[ AXP ] has closed above bottom band by 25.1%. Bollinger Bands are 12.6% narrower than normal. The current width of the bands does not suggest anything about the future direction or movement of prices. |
| Company profile |
|---|
| American Express Company, together with its subsidiaries, provides charge and credit payment card products, and travel-related services worldwide. The company operates through three segments: Global Consumer Services Group, Global Commercial Services, and Global Merchant and Network Services. Its products and services include payment and financing products; network services; accounts payable expense management products and services; and travel and lifestyle services. The company's products and services also comprise merchant acquisition and processing, servicing and settlement, point-of-sale marketing, and information products and services for merchants; and fraud prevention services, as well as the design and operation of customer loyalty programs. It sells its products and services to consumers, small businesses, mid-sized companies, and large corporations through mobile and online applications, third-party vendors and business partners, direct mail, telephone, in-house sales teams, and direct response advertising. American Express Company was founded in 1850 and is headquartered in New York, New York. |
| Stock chart |
|---|
 |
| Financial Analysis | |
|---|---|
| Price to Book Value: | Outperform |
| P/BV, a ratio used to compare book value to its current market price, to gauge whether a stock is valued properly. | |
| Price to Earnings: | Outperform |
| PE, the ratio for valuing a company that measures its current share price relative to its earnings per share (EPS). | |
| Discounted cash flow: | Outperform |
| DCF, a valuation method used to estimate the value of an investment based on its expected future cash flows. | |
| Return on Assets: | Outperform |
| ROA, indicates how profitable a company is in relation to its total assets, how efficiently uses assets to generate a profit. | |
| Return on Equity: | Outperform |
| ROE, a measure of financial performance calculated by dividing net income by equity. a gauge of profitability and efficiency. | |
| Debt to Equity: | Outperform |
| evaluate financial leverage, reflects the ability of equity to cover outstanding debts in the event of a business downturn. | |
| Stock Basics & Statistics | |
|---|---|
| Exchange: New York Stock Exchange | |
| Sector: Financial Services | |
| Industry: Financial - Credit Services | |
| Shares Out. (M) | 720.04 |
| Shares Float (M) | 569.66 |
| % Held by Insiders | 21.06 |
| % Held by Institutions | 65.28 |
| Shares Short (K) | 6660 |
| Shares Short Prior Month (K) | 8320 |
| Stock Financials | |
|---|---|
| EPS | 11.220 |
| Book Value (p.s.) | 38.810 |
| Profit Margin | 15.06 |
| Operating Margin | 17.36 |
| Return on Assets (ttm) | 3.4 |
| Return on Equity (ttm) | 31.7 |
| Qtrly Rev. Growth | 9.2 |
| Gross Profit (p.s.) | |
| Sales Per Share | 77.204 |
| EBITDA (p.s.) | |
| Qtrly Earnings Growth | 26.30 |
| Operating Cash Flow (M) | 18560.00 |
| Levered Free Cash Flow (M) | |
| Stock Valuation | |
|---|---|
| PE Ratio | 19.39 |
| PEG Ratio | 1.16 |
| Price to Book value | 5.60 |
| Price to Sales | 2.82 |
| Price to Cash Flow | 8.44 |
| Stock Dividends | |
|---|---|
| Dividend | |
| Dividend Yield | |
| Dividend Growth | |


