| Bausch Health Companies Inc (BHC) | |||
|---|---|---|---|
| 8.565 -0.035 (-0.41%) | 04-19 14:53 | ||
| Open: | 8.57 | Pre. Close: | 8.6 |
| High: | 8.76 | Low: | 8.56 |
| Volume: | 1,859,468 | Market Cap: | 3,130(M) |
| Stock Technical Analysis | |
|---|---|
| Overall: |  |
| Target: | Six months: 12.00 One year: 13.39 |
| Support: | Support1: 8.36 Support2: 6.96 |
| Resistance: | Resistance1: 10.28 Resistance2: 11.46 |
| Pivot: | 9.46 |
| Moving Averages: | MA(5): 8.68 MA(20): 9.54 MA(100): 8.48 MA(250): 8.10 |
| MACD: | MACD(12,26): -0.19 Signal(12,26,9): -0.02 |
| %K %D: | %K(14,3): 9.89 %D(3): 10.47 |
| RSI: | RSI(14): 36.66 |
| 52-Week: | High: 11.46 Low: 5.57 Change(%): 11.8 |
| Average Vol(K): | 3-Month: 2771 10-Days: 4715 |
| Prices Prediction (Update @5:00pm) | ||
|---|---|---|
| If tomorrow: | Open lower | Open higher |
| High: | 8.941 - 8.985 | 8.985 - 9.028 |
| Low: | 8.523 - 8.577 | 8.577 - 8.63 |
| Close: | 8.56 - 8.646 | 8.646 - 8.73 |
| Price, MAs and Bollinger Bands |
|---|
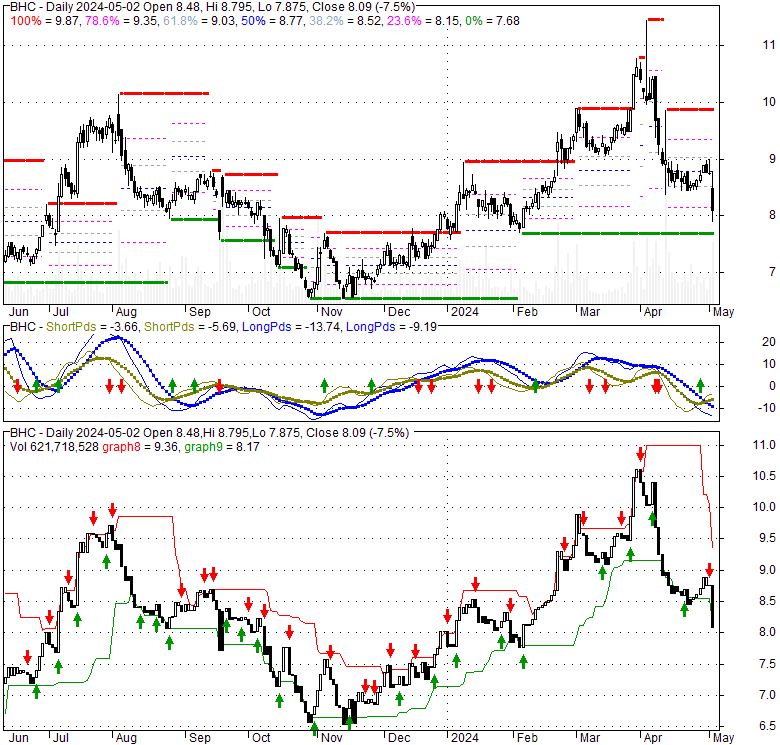
| Price has closed below its short-term moving average. Short-term moving average is currently below mid-term; and above long-term moving average. From the relationship between price and moving averages: This stock is BEARISH in short-term; and NEUTRAL in mid-long term.[ BHC ] has closed above bottom band by 20.5%. Bollinger Bands are 154.9% wider than normal. The large width of the bands suggest high volatility as compared to its normal range. The bands have been in this wide range for 14 days. This is a sign that the current trend might continue. |
| Company profile |
|---|
| Bausch Health Companies Inc., together with its subsidiaries, develops, manufactures, and markets a range of pharmaceutical, medical device, and over-the-counter (OTC) products primarily in the therapeutic areas of eye health, gastroenterology, and dermatology. The company operates through five segments: Bausch + Lomb, Salix, International Rx, Ortho Dermatologics, and Diversified Products. The Bausch + Lomb segment offers products with a focus on the vision care, surgical, and consumer, surgical, and ophthalmic pharmaceuticals products. The Salix segment provides gastroenterology products in the United States. The International Rx segment offers Solta products, branded and generic pharmaceutical products, OTC products, and medical device products, and Bausch + Lomb products in Canada, Europe, Asia, Australia, Latin America, Africa, and the Middle East. The Ortho Dermatologics segment provides dermatological products in the United States; and Solta medical aesthetic devices internationally. The Diversified Products segment offers pharmaceutical products in the areas of neurology and other therapeutic classes, as well as generic and dentistry products in the United States. The company was formerly known as Valeant Pharmaceuticals International, Inc. and changed its name to Bausch Health Companies Inc. in July 2018. Bausch Health Companies Inc. is headquartered in Laval, Canada. |
| Stock chart |
|---|
 |
| Financial Analysis | |
|---|---|
| Price to Book Value: | Underperform |
| P/BV, a ratio used to compare book value to its current market price, to gauge whether a stock is valued properly. | |
| Price to Earnings: | Outperform |
| PE, the ratio for valuing a company that measures its current share price relative to its earnings per share (EPS). | |
| Discounted cash flow: | Outperform |
| DCF, a valuation method used to estimate the value of an investment based on its expected future cash flows. | |
| Return on Assets: | Outperform |
| ROA, indicates how profitable a company is in relation to its total assets, how efficiently uses assets to generate a profit. | |
| Return on Equity: | Underperform |
| ROE, a measure of financial performance calculated by dividing net income by equity. a gauge of profitability and efficiency. | |
| Debt to Equity: | Underperform |
| evaluate financial leverage, reflects the ability of equity to cover outstanding debts in the event of a business downturn. | |
| Stock Basics & Statistics | |
|---|---|
| Exchange: New York Stock Exchange | |
| Sector: Healthcare | |
| Industry: Drug Manufacturers - Specialty & Generic | |
| Shares Out. (M) | 366.67 |
| Shares Float (M) | 303.99 |
| % Held by Insiders | 8.04 |
| % Held by Institutions | 79.62 |
| Shares Short (K) | 22500 |
| Shares Short Prior Month (K) | 24640 |
| Stock Financials | |
|---|---|
| EPS | -1.620 |
| Book Value (p.s.) | -2.800 |
| Profit Margin | -6.76 |
| Operating Margin | 21.06 |
| Return on Assets (ttm) | 3.8 |
| Return on Equity (ttm) | -686.5 |
| Qtrly Rev. Growth | 9.8 |
| Gross Profit (p.s.) | |
| Sales Per Share | 23.891 |
| EBITDA (p.s.) | 7.854 |
| Qtrly Earnings Growth | |
| Operating Cash Flow (M) | 1030.00 |
| Levered Free Cash Flow (M) | 738.12 |
| Stock Valuation | |
|---|---|
| PE Ratio | -5.31 |
| PEG Ratio | 0.88 |
| Price to Book value | -3.07 |
| Price to Sales | 0.36 |
| Price to Cash Flow | 3.06 |
| Stock Dividends | |
|---|---|
| Dividend | |
| Dividend Yield | |
| Dividend Growth | |