| Biogen Inc (BIIB) | |||
|---|---|---|---|
| 198.985 -3.005 (-1.49%) | 04-25 11:34 | ||
| Open: | 201.21 | Pre. Close: | 201.99 |
| High: | 205.3632 | Low: | 198.11 |
| Volume: | 535,291 | Market Cap: | 28,925(M) |
| Stock Technical Analysis | |
|---|---|
| Overall: |  |
| Target: | Six months: 244.58 One year: 258.99 |
| Support: | Support1: 189.44 Support2: 157.61 |
| Resistance: | Resistance1: 209.40 Resistance2: 221.74 |
| Pivot: | 198.43 |
| Moving Averages: | MA(5): 196.61 MA(20): 201.31 MA(100): 230.66 MA(250): 254.86 |
| MACD: | MACD(12,26): -5.64 Signal(12,26,9): -6.41 |
| %K %D: | %K(14,3): 43.35 %D(3): 31.69 |
| RSI: | RSI(14): 42.96 |
| 52-Week: | High: 319.76 Low: 189.44 Change(%): -32.1 |
| Average Vol(K): | 3-Month: 1258 10-Days: 1398 |
| Prices Prediction (Update @5:00pm) | ||
|---|---|---|
| If tomorrow: | Open lower | Open higher |
| High: | 206.044 - 207.198 | 207.198 - 208.254 |
| Low: | 195.94 - 197.442 | 197.442 - 198.817 |
| Close: | 199.815 - 201.991 | 201.991 - 203.984 |
| Price, MAs and Bollinger Bands |
|---|
| Price has closed above its short-term moving average. Short-term moving average is currently below mid-term; and below long-term moving average. From the relationship between price and moving averages: This stock is NEUTRAL in short-term; and BEARISH in mid-long term.[ BIIB ] has closed below upper band by 45.0%. Bollinger Bands are 11.7% narrower than normal. The current width of the bands does not suggest anything about the future direction or movement of prices. |
| Company profile |
|---|
| Biogen Inc. discovers, develops, manufactures, and delivers therapies for treating neurological and neurodegenerative diseases. The company offers TECFIDERA, VUMERITY, AVONEX, PLEGRIDY, TYSABRI, and FAMPYRA for multiple sclerosis (MS); SPINRAZA for spinal muscular atrophy; and FUMADERM to treat plaque psoriasis. It also provides BENEPALI, an etanercept biosimilar referencing ENBREL; ADUHELM for the treatment of Alzheimer's disease; IMRALDI, an adalimumab biosimilar referencing HUMIRA; and FLIXABI, an infliximab biosimilar referencing REMICADE. In addition, the company offers RITUXAN for treating non-Hodgkin's lymphoma, chronic lymphocytic leukemia (CLL), rheumatoid arthritis, two forms of ANCA-associated vasculitis, and pemphigus vulgaris; RITUXAN HYCELA for non-Hodgkin's lymphoma and CLL; GAZYVA to treat CLL and follicular lymphoma; and OCREVUS for treating relapsing MS and primary progressive MS; and other anti-CD20 therapies. Further, it develops BIIB135, BIIB061, BIIB091, and BIIB107 for MS and neuroimmunology; Aducanumab, Lecanemab, BIIB076, and BIIB080 to treat Alzheimer's disease and dementia; BIIB067, BIIB078, BIIB105, BIIB100, and BIIB110 to treat neuromuscular disorders; BIIB124, BIIB094, BIIB118, BIIB101, and BIIB122 for treating Parkinson's disease and movement disorders; BIIB125 and BIIB104 for treating neuropsychiatry; Dapirolizumab pegol and BIIB059 to treat immunology related diseases; BIIB093 and BIIB131 to treat acute neurology; BIIB074 for neuropathic pain; and BYOOVIZ, BIIB800, and SB15 biosimilars, which are under various stages of development. The company has collaboration and license agreements with Acorda Therapeutics, Inc.; Alkermes Pharma Ireland Limited; Denali Therapeutics Inc.; Eisai Co., Ltd.; Genentech, Inc.; Neurimmune SubOne AG; Ionis Pharmaceuticals, Inc.; Samsung Bioepis Co., Ltd.; Sangamo Therapeutics, Inc.; and Sage Therapeutics, Inc. Biogen Inc. was founded in 1978 and is headquartered in Cambridge, Massachusetts. |
| Stock chart |
|---|
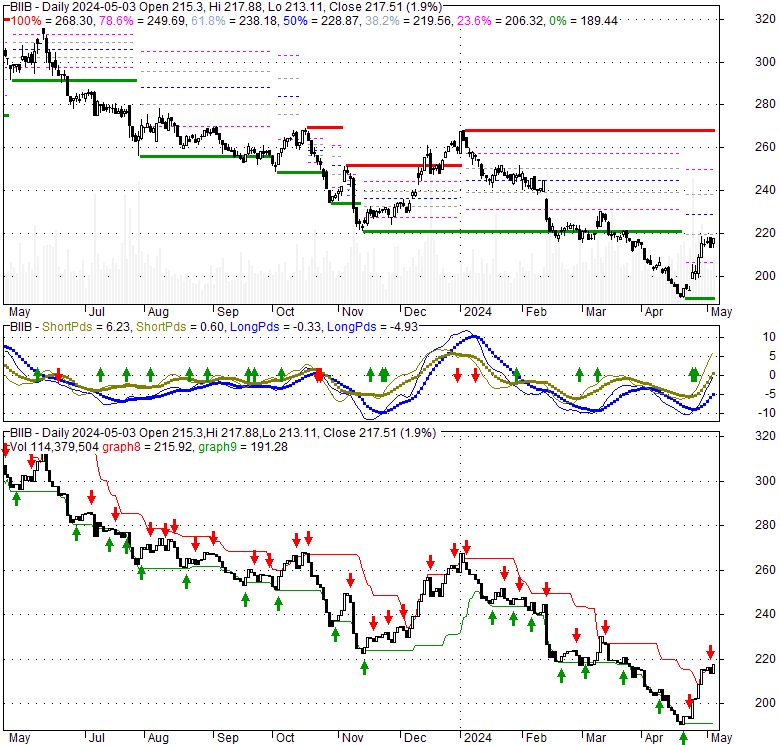 |
| Financial Analysis | |
|---|---|
| Price to Book Value: | Neutral |
| P/BV, a ratio used to compare book value to its current market price, to gauge whether a stock is valued properly. | |
| Price to Earnings: | Outperform |
| PE, the ratio for valuing a company that measures its current share price relative to its earnings per share (EPS). | |
| Discounted cash flow: | Outperform |
| DCF, a valuation method used to estimate the value of an investment based on its expected future cash flows. | |
| Return on Assets: | Outperform |
| ROA, indicates how profitable a company is in relation to its total assets, how efficiently uses assets to generate a profit. | |
| Return on Equity: | Outperform |
| ROE, a measure of financial performance calculated by dividing net income by equity. a gauge of profitability and efficiency. | |
| Debt to Equity: | Outperform |
| evaluate financial leverage, reflects the ability of equity to cover outstanding debts in the event of a business downturn. | |
| Stock Basics & Statistics | |
|---|---|
| Exchange: NASDAQ Global Select | |
| Sector: Healthcare | |
| Industry: Drug Manufacturers - General | |
| Shares Out. (M) | 145.36 |
| Shares Float (M) | 144.82 |
| % Held by Insiders | 0.69 |
| % Held by Institutions | 92.99 |
| Shares Short (K) | 3550 |
| Shares Short Prior Month (K) | 2800 |
| Stock Financials | |
|---|---|
| EPS | 7.970 |
| Book Value (p.s.) | 102.140 |
| Profit Margin | 11.81 |
| Operating Margin | 19.32 |
| Return on Assets (ttm) | 4.6 |
| Return on Equity (ttm) | 8.2 |
| Qtrly Rev. Growth | -6.2 |
| Gross Profit (p.s.) | |
| Sales Per Share | 67.694 |
| EBITDA (p.s.) | 16.373 |
| Qtrly Earnings Growth | -54.90 |
| Operating Cash Flow (M) | 1550.00 |
| Levered Free Cash Flow (M) | 971.06 |
| Stock Valuation | |
|---|---|
| PE Ratio | 25.02 |
| PEG Ratio | 4.41 |
| Price to Book value | 1.95 |
| Price to Sales | 2.94 |
| Price to Cash Flow | 18.70 |
| Stock Dividends | |
|---|---|
| Dividend | |
| Dividend Yield | |
| Dividend Growth | |


