| Chesapeake Energy Corp (CHK) | |||
|---|---|---|---|
| 88.41 0.9 (1.03%) | 04-22 16:00 | ||
| Open: | 87.13 | Pre. Close: | 87.51 |
| High: | 89.12 | Low: | 86.65 |
| Volume: | 1,179,750 | Market Cap: | 11,564(M) |
| Stock Technical Analysis | |
|---|---|
| Overall: |  |
| Target: | Six months: 106.32 One year: 124.19 |
| Support: | Support1: 85.95 Support2: 82.81 |
| Resistance: | Resistance1: 91.03 Resistance2: 106.32 |
| Pivot: | 88.67 |
| Moving Averages: | MA(5): 87.53 MA(20): 88.44 MA(100): 80.87 MA(250): 82.38 |
| MACD: | MACD(12,26): 0.85 Signal(12,26,9): 1.28 |
| %K %D: | %K(14,3): 41.21 %D(3): 36.57 |
| RSI: | RSI(14): 57.53 |
| 52-Week: | High: 91.03 Low: 72.84 Change(%): 7.2 |
| Average Vol(K): | 3-Month: 1893 10-Days: 1385 |
| Prices Prediction (Update @5:00pm) | ||
|---|---|---|
| If tomorrow: | Open lower | Open higher |
| High: | 89.254 - 89.614 | 89.614 - 89.984 |
| Low: | 85.775 - 86.145 | 86.145 - 86.526 |
| Close: | 87.797 - 88.446 | 88.446 - 89.115 |
| Price, MAs and Bollinger Bands |
|---|
| Price has closed above its short-term moving average. Short-term moving average is currently above mid-term; and above long-term moving average. From the relationship between price and moving averages: This stock is BULLISH in short-term; and BULLISH in mid-long term.[ CHK ] has closed above bottom band by 44.3%. Bollinger Bands are 32.3% narrower than normal. The current width of the bands does not suggest anything about the future direction or movement of prices. |
| Company profile |
|---|
| Chesapeake Energy Corporation, an independent exploration and production company, engages in the acquisition, exploration, and development of properties for the production of oil, natural gas, and natural gas liquids from underground reservoirs in the United States. The company holds interests in natural gas resource plays in the Marcellus Shale in the northern Appalachian Basin in Pennsylvania and the Haynesville/Bossier Shales in northwestern Louisiana; and the liquids-rich resource play in the Eagle Ford Shale in South Texas. As of December 31, 2021, it owned interests in approximately 8,200 gross productive wells, including 6,500 wells with working interest and 1,700 wells with an overriding or royalty interest; and had estimated proved reserves of 661 million barrels of oil equivalent. The company was founded in 1989 and is headquartered in Oklahoma City, Oklahoma. |
| Stock chart |
|---|
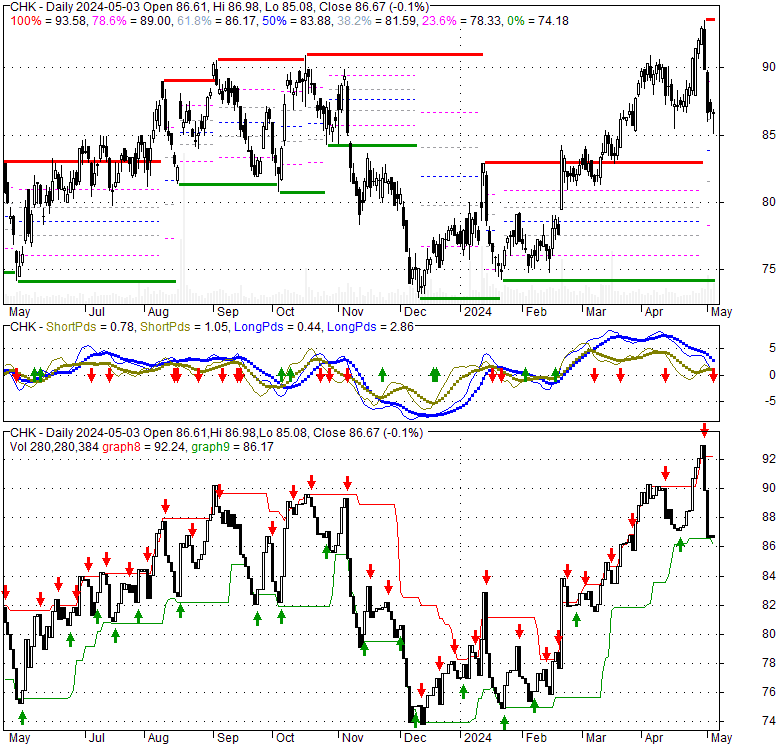 |
| Financial Analysis | |
|---|---|
| Price to Book Value: | Neutral |
| P/BV, a ratio used to compare book value to its current market price, to gauge whether a stock is valued properly. | |
| Price to Earnings: | Outperform |
| PE, the ratio for valuing a company that measures its current share price relative to its earnings per share (EPS). | |
| Discounted cash flow: | Outperform |
| DCF, a valuation method used to estimate the value of an investment based on its expected future cash flows. | |
| Return on Assets: | Outperform |
| ROA, indicates how profitable a company is in relation to its total assets, how efficiently uses assets to generate a profit. | |
| Return on Equity: | Outperform |
| ROE, a measure of financial performance calculated by dividing net income by equity. a gauge of profitability and efficiency. | |
| Debt to Equity: | Outperform |
| evaluate financial leverage, reflects the ability of equity to cover outstanding debts in the event of a business downturn. | |
| Stock Basics & Statistics | |
|---|---|
| Exchange: NASDAQ Global Select | |
| Sector: Energy | |
| Industry: Oil & Gas Exploration & Production | |
| Shares Out. (M) | 130.79 |
| Shares Float (M) | 111.77 |
| % Held by Insiders | 4.81 |
| % Held by Institutions | 103.00 |
| Shares Short (K) | 15840 |
| Shares Short Prior Month (K) | 14440 |
| Stock Financials | |
|---|---|
| EPS | 16.920 |
| Book Value (p.s.) | 82.030 |
| Profit Margin | 40.00 |
| Operating Margin | 46.16 |
| Return on Assets (ttm) | 9.2 |
| Return on Equity (ttm) | 24.4 |
| Qtrly Rev. Growth | -59.3 |
| Gross Profit (p.s.) | |
| Sales Per Share | 46.257 |
| EBITDA (p.s.) | 28.595 |
| Qtrly Earnings Growth | -83.30 |
| Operating Cash Flow (M) | 2380.00 |
| Levered Free Cash Flow (M) | 703.63 |
| Stock Valuation | |
|---|---|
| PE Ratio | 5.23 |
| PEG Ratio | 1.39 |
| Price to Book value | 1.08 |
| Price to Sales | 1.91 |
| Price to Cash Flow | 4.86 |
| Stock Dividends | |
|---|---|
| Dividend | 0.570 |
| Dividend Yield | 0.01 |
| Dividend Growth | |


