| Cloudera Inc (CLDR) | |||
|---|---|---|---|
| 0 (0%) | 04-19 06:57 | ||
| Open: | Pre. Close: | ||
| High: | Low: | ||
| Volume: | 0 | Market Cap: | 0(M) |
| Stock Technical Analysis | |
|---|---|
| Overall: |  |
| Target: | Six months: 18.69 One year: 21.83 |
| Support: | Support1: 15.88 Support2: 15.81 |
| Resistance: | Resistance1: 16.00 Resistance2: 18.69 |
| Pivot: | 15.95 |
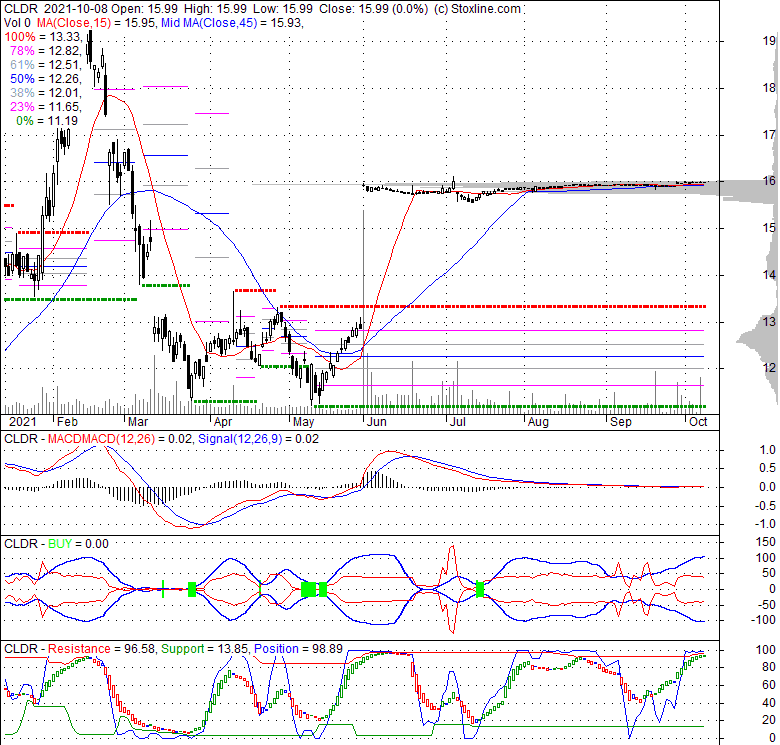
| Moving Averages: | MA(5): 15.99 MA(20): 15.95 MA(100): 15.60 MA(250): 14.10 |
| MACD: | MACD(12,26): 0.02 Signal(12,26,9): 0.02 |
| %K %D: | %K(14,3): 94.64 %D(3): 95.78 |
| RSI: | RSI(14): 62.61 |
| 52-Week: | High: Low: Change(%): 34.7 |
| Average Vol(K): | 3-Month: 372067 10-Days: 479115 |
| Prices Prediction (Update @5:00pm) | ||
|---|---|---|
| If tomorrow: | Open lower | Open higher |
| High: | 16.027 - 16.106 | 16.106 - 16.17 |
| Low: | 15.766 - 15.876 | 15.876 - 15.966 |
| Close: | 15.838 - 16.002 | 16.002 - 16.136 |
| Price, MAs and Bollinger Bands |
|---|
| Price and moving averages has closed above its Short term moving average. Short term moving average is currently above mid-term; AND above long term moving averages. From the relationship between price and moving averages; we can see that: This stock is BULLISH in short-term; and BULLISH in mid-long term.CLDR has closed below upper band by 23.0%. Bollinger Bands are 85% narrower than normal. The narrow width of the bands suggests low volatility as compared to CLDR's normal range. The bands have been in this narrow range for 77 bars. This is a sign that the market may be about to initiate a new trend. |
| Company profile |
|---|
| Cloudera, Inc. provides a suite of data analytics and management products in the United States, Europe, and Asia. The company operates through two segments, Subscription and Services. It offers Cloudera Enterprise Data Hub that allows companies to execute various analytic functions against a shared set of governed and secures data in public and private clouds, and data centers; Cloudera Data Warehouse, a hybrid cloud solution for self-service analytics; Cloudera Data Science and Engineering enables users to streamline, simplify, and scale big data processing; and Cloudera Operational DB that enables stream processing and real-time analytics on continuously changing data. The company also provides Hortonworks Data Platform, a data management platform that helps organizations to securely store, process, and analyze various data assets; Cloudera DataFlow, a data platform that collects, curates and analyzes data; Cloudera Data Science Workbench that enables self-service data science for the enterprise; and Cloudera Altus, a platform-as-a-service offering In addition, it offers Cloudera SDX, a solution that enables common security, governance, lineage, and metadata management for multiple analytics functions; and Cloudera Workload XM, an analytic workload experience management cloud service. Further, the company provides consulting, professional, and education services. It serves corporate enterprises and public sector organizations primarily through its direct sales force. The company was founded in 2008 and is headquartered in Palo Alto, California. |
| Stock chart |
|---|
 |
| Financial Analysis | |
|---|---|
| Price to Book Value: | Outperform |
| P/BV, a ratio used to compare book value to its current market price, to gauge whether a stock is valued properly. | |
| Price to Earnings: | Underperform |
| PE, the ratio for valuing a company that measures its current share price relative to its earnings per share (EPS). | |
| Discounted cash flow: | Outperform |
| DCF, a valuation method used to estimate the value of an investment based on its expected future cash flows. | |
| Return on Assets: | Neutral |
| ROA, indicates how profitable a company is in relation to its total assets, how efficiently uses assets to generate a profit. | |
| Return on Equity: | Neutral |
| ROE, a measure of financial performance calculated by dividing net income by equity. a gauge of profitability and efficiency. | |
| Debt to Equity: | Outperform |
| evaluate financial leverage, reflects the ability of equity to cover outstanding debts in the event of a business downturn. | |
| Stock Basics & Statistics | |
|---|---|
| Exchange: New York Stock Exchange | |
| Sector: Technology | |
| Industry: Software - Application | |
| Shares Out. (M) | 292.22 |
| Shares Float (M) | 286.98 |
| % Held by Insiders | 1.42 |
| % Held by Institutions | 81.64 |
| Shares Short (K) | 17560 |
| Shares Short Prior Month (K) | 11820 |
| Stock Financials | |
|---|---|
| EPS | -0.480 |
| Book Value (p.s.) | 3.790 |
| Profit Margin | -16.43 |
| Operating Margin | -11.14 |
| Return on Assets (ttm) | -2.7 |
| Return on Equity (ttm) | -11.6 |
| Qtrly Rev. Growth | 6.6 |
| Gross Profit (p.s.) | 2.327 |
| Sales Per Share | 3.022 |
| EBITDA (p.s.) | -0.041 |
| Qtrly Earnings Growth | |
| Operating Cash Flow (M) | 249.68 |
| Levered Free Cash Flow (M) | 382.06 |
| Stock Valuation | |
|---|---|
| PE Ratio | -33.31 |
| PEG Ratio | |
| Price to Book value | 4.22 |
| Price to Sales | 5.29 |
| Price to Cash Flow | 18.71 |
| Stock Dividends | |
|---|---|
| Dividend | |
| Dividend Yield | |
| Dividend Growth | |