| Catalyst Pharm Inc (CPRX) | |||
|---|---|---|---|
| 14.68 -0.44 (-2.91%) | 04-25 16:00 | ||
| Open: | 14.82 | Pre. Close: | 15.12 |
| High: | 15.01 | Low: | 14.585 |
| Volume: | 868,239 | Market Cap: | 1,730(M) |
| Stock Technical Analysis | |
|---|---|
| Overall: |  |
| Target: | Six months: 19.09 One year: 20.36 |
| Support: | Support1: 14.59 Support2: 12.13 |
| Resistance: | Resistance1: 16.34 Resistance2: 17.43 |
| Pivot: | 15.36 |
| Moving Averages: | MA(5): 14.95 MA(20): 15.40 MA(100): 15.12 MA(250): 14.00 |
| MACD: | MACD(12,26): -0.19 Signal(12,26,9): -0.09 |
| %K %D: | %K(14,3): 10.45 %D(3): 10.51 |
| RSI: | RSI(14): 41.25 |
| 52-Week: | High: 17.77 Low: 11.09 Change(%): -6.9 |
| Average Vol(K): | 3-Month: 1347 10-Days: 1715 |
| Prices Prediction (Update @5:00pm) | ||
|---|---|---|
| If tomorrow: | Open lower | Open higher |
| High: | 15.052 - 15.136 | 15.136 - 15.204 |
| Low: | 14.333 - 14.451 | 14.451 - 14.546 |
| Close: | 14.507 - 14.681 | 14.681 - 14.823 |
| Price, MAs and Bollinger Bands |
|---|
| Price has closed below its short-term moving average. Short-term moving average is currently below mid-term; and below long-term moving average. From the relationship between price and moving averages: This stock is BEARISH in short-term; and NEUTRAL in mid-long term.[ CPRX ] has closed above bottom band by 5.7%. Bollinger Bands are 39.5% narrower than normal. The current width of the bands does not suggest anything about the future direction or movement of prices. |
| Company profile |
|---|
| Catalyst Pharmaceuticals, Inc., a commercial-stage biopharmaceutical company, focuses on developing and commercializing therapies for people with rare debilitating, chronic neuromuscular, and neurological diseases in the United States. It offers Firdapse, an amifampridine phosphate tablets for the treatment of patients with lambert-eaton myasthenic syndrome (LEMS); and Ruzurgi for the treatment of pediatric LEMS patients. The company also develops Firdapse for the treatment of MuSK antibody positive myasthenia gravis, and spinal muscular atrophy type 3, as well as to treat hereditary neuropathy with liability to pressure palsies. It has license agreements with BioMarin Pharmaceutical Inc.; and collaboration and license agreement with Endo Ventures Limited for the development and commercialization of generic Sabril tablets. The company was formerly known as Catalyst Pharmaceutical Partners, Inc. and changed its name to Catalyst Pharmaceuticals, Inc. in May 2015. Catalyst Pharmaceuticals, Inc. was founded in 2002 and is based in Coral Gables, Florida. |
| Stock chart |
|---|
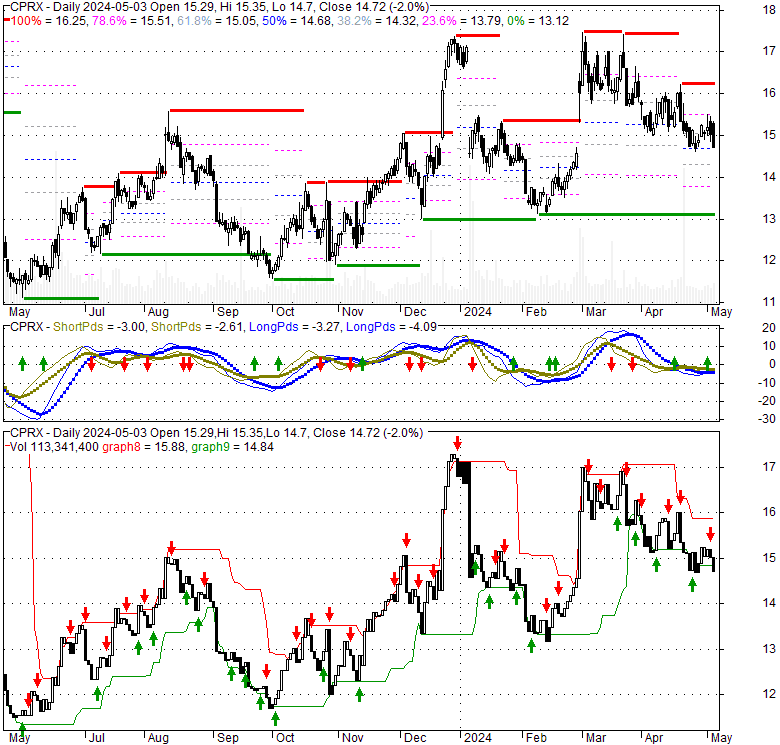 |
| Financial Analysis | |
|---|---|
| Price to Book Value: | Outperform |
| P/BV, a ratio used to compare book value to its current market price, to gauge whether a stock is valued properly. | |
| Price to Earnings: | Outperform |
| PE, the ratio for valuing a company that measures its current share price relative to its earnings per share (EPS). | |
| Discounted cash flow: | Neutral |
| DCF, a valuation method used to estimate the value of an investment based on its expected future cash flows. | |
| Return on Assets: | Outperform |
| ROA, indicates how profitable a company is in relation to its total assets, how efficiently uses assets to generate a profit. | |
| Return on Equity: | Outperform |
| ROE, a measure of financial performance calculated by dividing net income by equity. a gauge of profitability and efficiency. | |
| Debt to Equity: | Neutral |
| evaluate financial leverage, reflects the ability of equity to cover outstanding debts in the event of a business downturn. | |
| Stock Basics & Statistics | |
|---|---|
| Exchange: NASDAQ Capital Market | |
| Sector: Healthcare | |
| Industry: Biotechnology | |
| Shares Out. (M) | 118.01 |
| Shares Float (M) | 101.66 |
| % Held by Insiders | 6.21 |
| % Held by Institutions | 73.33 |
| Shares Short (K) | 6050 |
| Shares Short Prior Month (K) | 6470 |
| Stock Financials | |
|---|---|
| EPS | 0.630 |
| Book Value (p.s.) | 3.620 |
| Profit Margin | 17.93 |
| Operating Margin | 37.71 |
| Return on Assets (ttm) | 12.8 |
| Return on Equity (ttm) | 20.8 |
| Qtrly Rev. Growth | 82.0 |
| Gross Profit (p.s.) | |
| Sales Per Share | 3.374 |
| EBITDA (p.s.) | 1.014 |
| Qtrly Earnings Growth | 34.60 |
| Operating Cash Flow (M) | 143.60 |
| Levered Free Cash Flow (M) | -219.49 |
| Stock Valuation | |
|---|---|
| PE Ratio | 23.30 |
| PEG Ratio | |
| Price to Book value | 4.06 |
| Price to Sales | 4.35 |
| Price to Cash Flow | 12.06 |
| Stock Dividends | |
|---|---|
| Dividend | |
| Dividend Yield | |
| Dividend Growth | |


