| Dropbox Inc (DBX) | |||
|---|---|---|---|
| 24.02 0.55 (2.34%) | 04-24 16:00 | ||
| Open: | 23.45 | Pre. Close: | 23.47 |
| High: | 24.03 | Low: | 23.43 |
| Volume: | 2,427,147 | Market Cap: | 8,262(M) |
| Stock Technical Analysis | |
|---|---|
| Overall: |  |
| Target: | Six months: 28.90 One year: 33.75 |
| Support: | Support1: 23.44 Support2: 22.64 |
| Resistance: | Resistance1: 24.74 Resistance2: 28.90 |
| Pivot: | 23.21 |
| Moving Averages: | MA(5): 23.31 MA(20): 23.43 MA(100): 27.39 MA(250): 26.58 |
| MACD: | MACD(12,26): -0.36 Signal(12,26,9): -0.53 |
| %K %D: | %K(14,3): 69.01 %D(3): 44.60 |
| RSI: | RSI(14): 54.48 |
| 52-Week: | High: 33.43 Low: 19.545 Change(%): 15.0 |
| Average Vol(K): | 3-Month: 4254 10-Days: 2937 |
| Prices Prediction (Update @5:00pm) | ||
|---|---|---|
| If tomorrow: | Open lower | Open higher |
| High: | 24.032 - 24.116 | 24.116 - 24.193 |
| Low: | 23.189 - 23.297 | 23.297 - 23.396 |
| Close: | 23.847 - 23.999 | 23.999 - 24.138 |
| Price, MAs and Bollinger Bands |
|---|
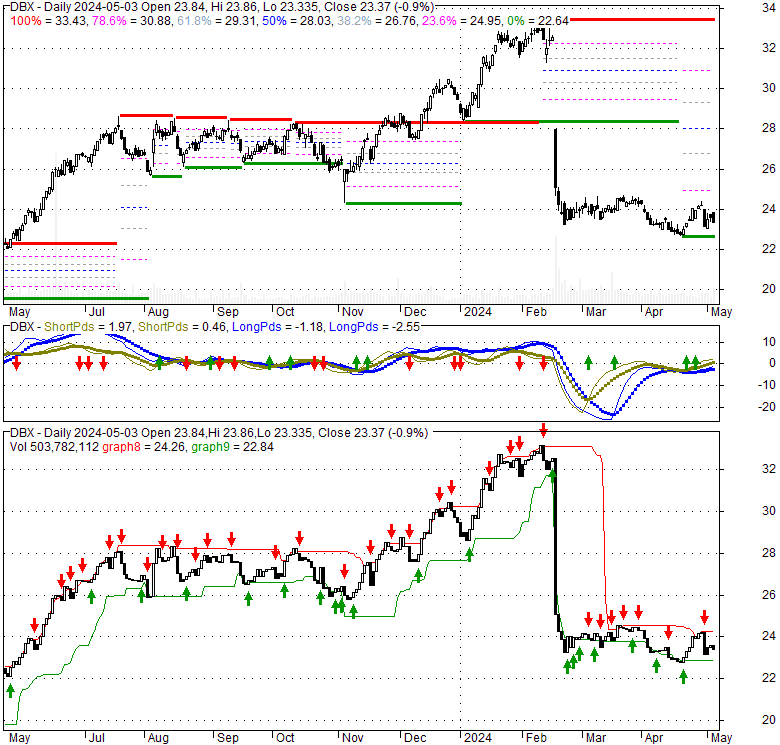
| Price has closed above its short-term moving average. Short-term moving average is currently below mid-term; and below long-term moving average. From the relationship between price and moving averages: This stock is NEUTRAL in short-term; and BEARISH in mid-long term.[ DBX ] has closed It is unclear right now based on current values. 67.4% narrower than normal. The narrow width of the bands suggests low volatility as compared to its normal range. The bands have been in this narrow range for 32 bars. This is a sign that the market may be about to initiate a new trend. |
| Company profile |
|---|
| Dropbox, Inc. provides a content collaboration platform worldwide. Its platform allows individuals, families, teams, and organizations to collaborate and sign up for free through its website or app, as well as upgrade to a paid subscription plan for premium features. As of December 31, 2021, the company had approximately 700 million registered users. It serves customers in professional services, technology, media, education, industrial, consumer and retail, and financial services industries. The company was formerly known as Evenflow, Inc. and changed its name to Dropbox, Inc. in October 2009. Dropbox, Inc. was incorporated in 2007 and is headquartered in San Francisco, California. |
| Stock chart |
|---|
 |
| Financial Analysis | |
|---|---|
| Price to Book Value: | Underperform |
| P/BV, a ratio used to compare book value to its current market price, to gauge whether a stock is valued properly. | |
| Price to Earnings: | Neutral |
| PE, the ratio for valuing a company that measures its current share price relative to its earnings per share (EPS). | |
| Discounted cash flow: | Outperform |
| DCF, a valuation method used to estimate the value of an investment based on its expected future cash flows. | |
| Return on Assets: | Outperform |
| ROA, indicates how profitable a company is in relation to its total assets, how efficiently uses assets to generate a profit. | |
| Return on Equity: | Underperform |
| ROE, a measure of financial performance calculated by dividing net income by equity. a gauge of profitability and efficiency. | |
| Debt to Equity: | Underperform |
| evaluate financial leverage, reflects the ability of equity to cover outstanding debts in the event of a business downturn. | |
| Stock Basics & Statistics | |
|---|---|
| Exchange: NASDAQ Global Select | |
| Sector: Technology | |
| Industry: Software - Infrastructure | |
| Shares Out. (M) | 258.37 |
| Shares Float (M) | 251.23 |
| % Held by Insiders | 4.14 |
| % Held by Institutions | 96.69 |
| Shares Short (K) | 21150 |
| Shares Short Prior Month (K) | 15190 |
| Stock Financials | |
|---|---|
| EPS | 1.310 |
| Book Value (p.s.) | -0.490 |
| Profit Margin | 18.13 |
| Operating Margin | 17.32 |
| Return on Assets (ttm) | 7.9 |
| Return on Equity (ttm) | |
| Qtrly Rev. Growth | 6.0 |
| Gross Profit (p.s.) | |
| Sales Per Share | 9.676 |
| EBITDA (p.s.) | 2.142 |
| Qtrly Earnings Growth | -27.80 |
| Operating Cash Flow (M) | 783.70 |
| Levered Free Cash Flow (M) | 757.29 |
| Stock Valuation | |
|---|---|
| PE Ratio | 18.34 |
| PEG Ratio | 1.44 |
| Price to Book value | -49.02 |
| Price to Sales | 2.48 |
| Price to Cash Flow | 7.92 |
| Stock Dividends | |
|---|---|
| Dividend | |
| Dividend Yield | |
| Dividend Growth | |