| Precision Biosciences Inc (DTIL) | |||
|---|---|---|---|
| 10.35 0.67 (6.92%) | 04-23 15:56 | ||
| Open: | 9.67 | Pre. Close: | 9.68 |
| High: | 10.36 | Low: | 9.52 |
| Volume: | 29,157 | Market Cap: | 72(M) |
| Stock Technical Analysis | |
|---|---|
| Overall: |  |
| Target: | Six months: 15.61 One year: 18.65 |
| Support: | Support1: 9.15 Support2: 7.61 |
| Resistance: | Resistance1: 13.36 Resistance2: 15.97 |
| Pivot: | 12.80 |
| Moving Averages: | MA(5): 10.38 MA(20): 13.04 MA(100): 12.18 MA(250): 14.53 |
| MACD: | MACD(12,26): -0.67 Signal(12,26,9): -0.16 |
| %K %D: | %K(14,3): 9.09 %D(3): 5.54 |
| RSI: | RSI(14): 36.91 |
| 52-Week: | High: 27.15 Low: 8.25 Change(%): -61.2 |
| Average Vol(K): | 3-Month: 133 10-Days: 84 |
| Prices Prediction (Update @5:00pm) | ||
|---|---|---|
| If tomorrow: | Open lower | Open higher |
| High: | 9.914 - 10.009 | 10.009 - 10.067 |
| Low: | 8.957 - 9.076 | 9.076 - 9.148 |
| Close: | 9.537 - 9.74 | 9.74 - 9.862 |
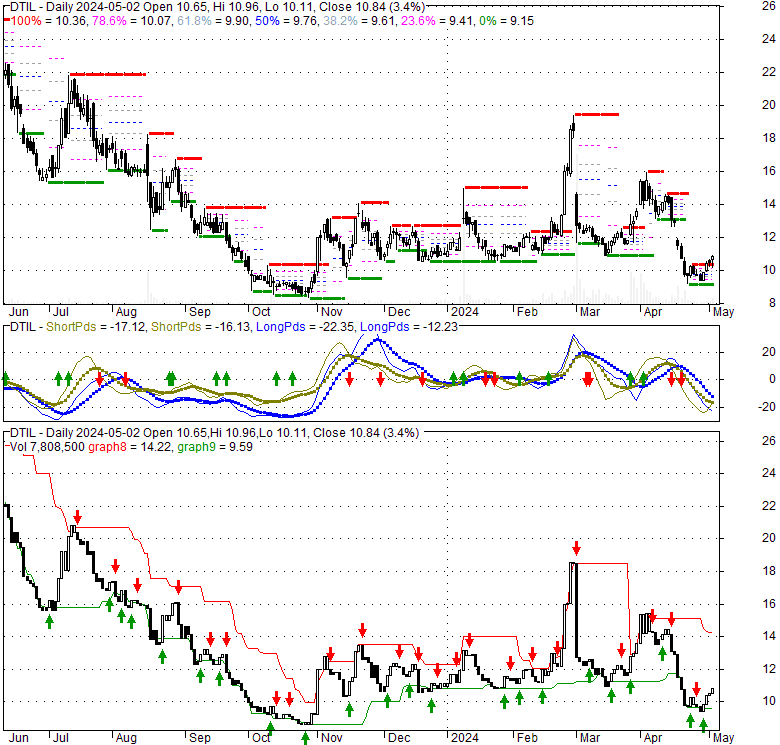
| Price, MAs and Bollinger Bands |
|---|
| Price has closed below its short-term moving average. Short-term moving average is currently below mid-term; and below long-term moving average. From the relationship between price and moving averages: This stock is BEARISH in short-term; and NEUTRAL in mid-long term.[ DTIL ] has closed above bottom band by 15.5%. Bollinger Bands are 83.9% wider than normal. The large width of the bands suggest high volatility as compared to its normal range. The bands have been in this wide range for 2 days. This is a sign that the current trend might continue. |
| Company profile |
|---|
| Precision BioSciences, Inc., a clinical stage gene editing company, develops in vivo gene editing and ex vivo allogeneic CAR T therapies in the United States. It offers ARCUS, a genome editing platform to cure genetic disorders. The company also provides Ex vivo Allogeneic CAR T Immunotherapy, a form of immunotherapy in which T cell, a specific type of immune cell is genetically engineered to recognize and kill cancer cells; PBCAR0191, which is in Phase 1/2a clinical trial in adult patients with R/R NHL or R/R B-cell precursor acute lymphoblastic leukemia, or B-ALL; PBCAR19B, an anti-CD19 CAR T candidate built on the stealth cell platform utilizing a single-step gene edit to minimize the risk of chromosome abnormalities; and PBCAR269A, an investigational allogeneic CAR T immunotherapy targeting BCMA for the treatment of R/R multiple myeloma. The company has development and commercial license agreement with Les Laboratoires Servier to develop allogeneic chimeric antigen receptor T cell therapies for antigen targets, hematological cancer targets beyond CD19, and solid tumor targets; Tiziana Life Sciences to evaluate foralumab, a fully human anti-CD3 monoclonal antibody as a lymphodepleting agent for the potential treatment of cancers; and iECURE, Inc. to develop ARCUS-based gene editing therapies. Precision BioSciences, Inc. was incorporated in 2006 and is headquartered in Durham, North Carolina. |
| Stock chart |
|---|
 |
| Financial Analysis | |
|---|---|
| Price to Book Value: | Neutral |
| P/BV, a ratio used to compare book value to its current market price, to gauge whether a stock is valued properly. | |
| Price to Earnings: | Neutral |
| PE, the ratio for valuing a company that measures its current share price relative to its earnings per share (EPS). | |
| Discounted cash flow: | Underperform |
| DCF, a valuation method used to estimate the value of an investment based on its expected future cash flows. | |
| Return on Assets: | Underperform |
| ROA, indicates how profitable a company is in relation to its total assets, how efficiently uses assets to generate a profit. | |
| Return on Equity: | Underperform |
| ROE, a measure of financial performance calculated by dividing net income by equity. a gauge of profitability and efficiency. | |
| Debt to Equity: | Outperform |
| evaluate financial leverage, reflects the ability of equity to cover outstanding debts in the event of a business downturn. | |
| Stock Basics & Statistics | |
|---|---|
| Exchange: NASDAQ Global Select | |
| Sector: Healthcare | |
| Industry: Biotechnology | |
| Shares Out. (M) | 6.92 |
| Shares Float (M) | 5.24 |
| % Held by Insiders | 8.48 |
| % Held by Institutions | 39.80 |
| Shares Short (K) | 289 |
| Shares Short Prior Month (K) | 49 |
| Stock Financials | |
|---|---|
| EPS | -332.120 |
| Book Value (p.s.) | 4.530 |
| Profit Margin | -125.84 |
| Operating Margin | -211.57 |
| Return on Assets (ttm) | -13.7 |
| Return on Equity (ttm) | -107.3 |
| Qtrly Rev. Growth | -33.6 |
| Gross Profit (p.s.) | |
| Sales Per Share | 7.042 |
| EBITDA (p.s.) | -5.335 |
| Qtrly Earnings Growth | |
| Operating Cash Flow (M) | -84.11 |
| Levered Free Cash Flow (M) | -50.41 |
| Stock Valuation | |
|---|---|
| PE Ratio | -0.03 |
| PEG Ratio | |
| Price to Book value | 2.26 |
| Price to Sales | 1.46 |
| Price to Cash Flow | -0.84 |
| Stock Dividends | |
|---|---|
| Dividend | |
| Dividend Yield | |
| Dividend Growth | |


