| Dynavax Technologies (DVAX) | |||
|---|---|---|---|
| 11.29 -0.13 (-1.14%) | 04-25 09:38 | ||
| Open: | 11.41 | Pre. Close: | 11.42 |
| High: | 11.41 | Low: | 11.28 |
| Volume: | 85,444 | Market Cap: | 1,475(M) |
| Stock Technical Analysis | |
|---|---|
| Overall: |  |
| Target: | Six months: 14.15 One year: 14.80 |
| Support: | Support1: 11.21 Support2: 9.33 |
| Resistance: | Resistance1: 12.11 Resistance2: 12.67 |
| Pivot: | 11.78 |
| Moving Averages: | MA(5): 11.63 MA(20): 11.93 MA(100): 12.97 MA(250): 13.18 |
| MACD: | MACD(12,26): -0.22 Signal(12,26,9): -0.22 |
| %K %D: | %K(14,3): 37.75 %D(3): 38.58 |
| RSI: | RSI(14): 35.91 |
| 52-Week: | High: 15.15 Low: 10.06 Change(%): 8.2 |
| Average Vol(K): | 3-Month: 1950 10-Days: 2552 |
| Prices Prediction (Update @5:00pm) | ||
|---|---|---|
| If tomorrow: | Open lower | Open higher |
| High: | 11.735 - 11.814 | 11.814 - 11.879 |
| Low: | 11.2 - 11.276 | 11.276 - 11.339 |
| Close: | 11.308 - 11.432 | 11.432 - 11.535 |
| Price, MAs and Bollinger Bands |
|---|
| Price has closed below its short-term moving average. Short-term moving average is currently below mid-term; and below long-term moving average. From the relationship between price and moving averages: This stock is BEARISH in short-term; and BEARISH in mid-long term.[ DVAX ] has closed above bottom band by 13.2%. Bollinger Bands are 17.3% narrower than normal. The current width of the bands does not suggest anything about the future direction or movement of prices. |
| Company profile |
|---|
| Dynavax Technologies Corporation, a biopharmaceutical company, focuses on developing and commercializing novel vaccines in the United States. The company markets HEPLISAV-B, a hepatitis B vaccine for prevention of infection caused by all known subtypes of hepatitis B virus in age 18 years and older in the United States and Europe. It also manufactures and sells CpG 1018, the adjuvant used in HEPLISAV-B. Dynavax Technologies Corporation has a collaboration agreement with Valneva Scotland Limited; agreement with Serum Institute of India Pvt. Ltd.; and sublicense agreement with Merck, Sharp & Dohme Corp. The company was formerly known as Double Helix Corporation and changed its name to Dynavax Technologies Corporation in September 1996. Dynavax Technologies Corporation was incorporated in 1996 and is headquartered in Emeryville, California. |
| Stock chart |
|---|
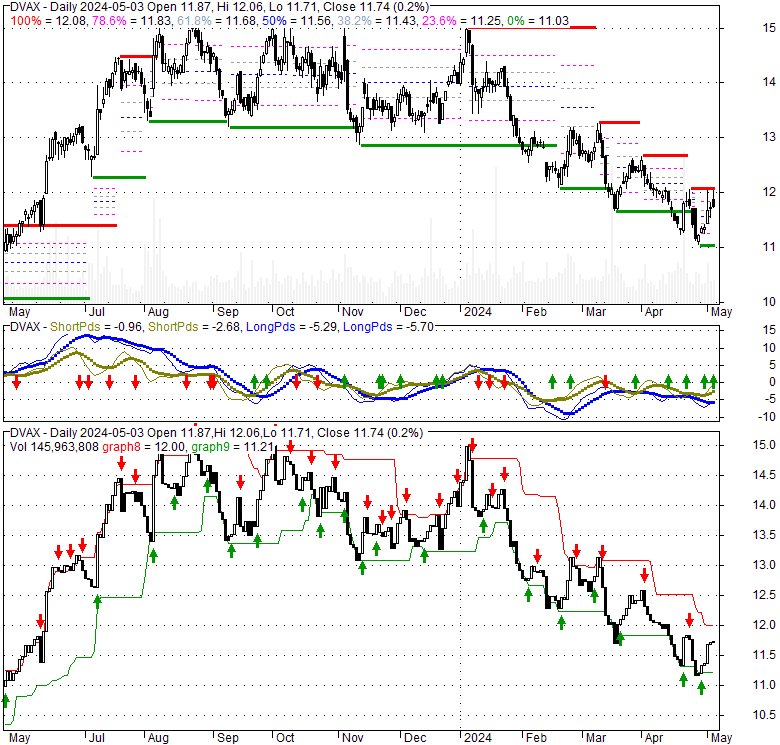 |
| Financial Analysis | |
|---|---|
| Price to Book Value: | Outperform |
| P/BV, a ratio used to compare book value to its current market price, to gauge whether a stock is valued properly. | |
| Price to Earnings: | Outperform |
| PE, the ratio for valuing a company that measures its current share price relative to its earnings per share (EPS). | |
| Discounted cash flow: | Outperform |
| DCF, a valuation method used to estimate the value of an investment based on its expected future cash flows. | |
| Return on Assets: | Neutral |
| ROA, indicates how profitable a company is in relation to its total assets, how efficiently uses assets to generate a profit. | |
| Return on Equity: | Neutral |
| ROE, a measure of financial performance calculated by dividing net income by equity. a gauge of profitability and efficiency. | |
| Debt to Equity: | Outperform |
| evaluate financial leverage, reflects the ability of equity to cover outstanding debts in the event of a business downturn. | |
| Stock Basics & Statistics | |
|---|---|
| Exchange: NASDAQ Capital Market | |
| Sector: Healthcare | |
| Industry: Drug Manufacturers - Specialty & Generic | |
| Shares Out. (M) | 130.86 |
| Shares Float (M) | 123.06 |
| % Held by Insiders | 0.31 |
| % Held by Institutions | 97.99 |
| Shares Short (K) | 17970 |
| Shares Short Prior Month (K) | 16370 |
| Stock Financials | |
|---|---|
| EPS | -0.050 |
| Book Value (p.s.) | 4.800 |
| Profit Margin | -2.75 |
| Operating Margin | -11.69 |
| Return on Assets (ttm) | -1.9 |
| Return on Equity (ttm) | -1.1 |
| Qtrly Rev. Growth | -69.9 |
| Gross Profit (p.s.) | |
| Sales Per Share | 1.775 |
| EBITDA (p.s.) | -0.200 |
| Qtrly Earnings Growth | |
| Operating Cash Flow (M) | 100.56 |
| Levered Free Cash Flow (M) | 98.14 |
| Stock Valuation | |
|---|---|
| PE Ratio | -228.40 |
| PEG Ratio | |
| Price to Book value | 2.38 |
| Price to Sales | 6.43 |
| Price to Cash Flow | 14.86 |
| Stock Dividends | |
|---|---|
| Dividend | |
| Dividend Yield | |
| Dividend Growth | |


