| Etsy Inc (ETSY) | |||
|---|---|---|---|
| 66.38 -1.97 (-2.88%) | 04-24 11:24 | ||
| Open: | 67.66 | Pre. Close: | 68.35 |
| High: | 68.49 | Low: | 66.21 |
| Volume: | 624,903 | Market Cap: | 7,865(M) |
| Stock Technical Analysis | |
|---|---|
| Overall: |  |
| Target: | Six months: 79.38 One year: 81.96 |
| Support: | Support1: 64.38 Support2: 53.56 |
| Resistance: | Resistance1: 67.96 Resistance2: 70.17 |
| Pivot: | 67.13 |
| Moving Averages: | MA(5): 67.17 MA(20): 66.99 MA(100): 73.13 MA(250): 76.61 |
| MACD: | MACD(12,26): -0.38 Signal(12,26,9): -0.58 |
| %K %D: | %K(14,3): 53.80 %D(3): 51.05 |
| RSI: | RSI(14): 47.46 |
| 52-Week: | High: 102.81 Low: 58.2 Change(%): -31.5 |
| Average Vol(K): | 3-Month: 3565 10-Days: 2398 |
| Prices Prediction (Update @5:00pm) | ||
|---|---|---|
| If tomorrow: | Open lower | Open higher |
| High: | 69.201 - 69.659 | 69.659 - 70.074 |
| Low: | 65.299 - 65.878 | 65.878 - 66.4 |
| Close: | 67.448 - 68.368 | 68.368 - 69.2 |
| Price, MAs and Bollinger Bands |
|---|
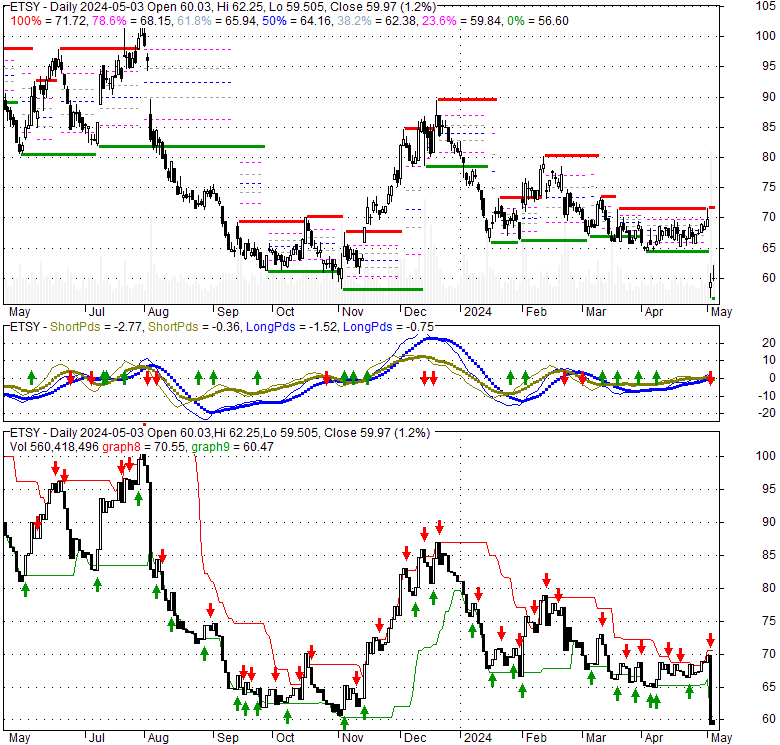
| Price has closed below its short-term moving average. Short-term moving average is currently below mid-term; and below long-term moving average. From the relationship between price and moving averages: This stock is BEARISH in short-term; and BEARISH in mid-long term.[ ETSY ] has closed above bottom band by 45.6%. Bollinger Bands are 61.8% narrower than normal. The narrow width of the bands suggests low volatility as compared to its normal range. The bands have been in this narrow range for 16 bars. This is a sign that the market may be about to initiate a new trend. |
| Company profile |
|---|
| Etsy, Inc. operates two-sided online marketplaces that connect buyers and sellers primarily in the United States, the United Kingdom, Germany, Canada, Australia, France, and India. Its primary marketplace is Etsy.com that connects artisans and entrepreneurs with various consumers. The company also offers Reverb, a musical instrument marketplace; Depop, a fashion resale marketplace; and Elo7, a Brazil-based marketplace for handmade and unique items. In addition, it offers various seller services, including Etsy Payments, a payment processing service; Etsy Ads, an advertising platform; and Shipping Labels, which allows sellers in the United States, Canada, the United Kingdom, Australia, and India to purchase discounted shipping labels. Further, the company provides various seller tools, including Shop Manager dashboard, a centralized hub for Etsy sellers to track orders, manage inventory, view metrics and statistics, and have conversations with their customers; and Sell on Etsy, an application to enable enhanced onboarding and video uploading. Additionally, it offers Etsy seller analytics pages that provides insights regarding traffic acquisition for their shops; Targeted Offers, a sales and promotions tool, and social media tool; and accounting and bookkeeping services. The company also provides educational resources comprising blog posts, video tutorials, Etsy Seller Handbook, Etsy.com online forums, and insights; Etsy Teams, a platform to build personal relationships with other Etsy sellers; and a Star Seller program. As of December 31, 2021, it connected a total of 7.5 million active sellers to 96.3 million active buyers; and had 120 million items for sale. The company was formerly known as Indieco, Inc changed its name to Etsy, Inc. in June 2006. Etsy, Inc. was founded in 2005 and is headquartered in Brooklyn, New York. |
| Stock chart |
|---|
 |
| Financial Analysis | |
|---|---|
| Price to Book Value: | Underperform |
| P/BV, a ratio used to compare book value to its current market price, to gauge whether a stock is valued properly. | |
| Price to Earnings: | Outperform |
| PE, the ratio for valuing a company that measures its current share price relative to its earnings per share (EPS). | |
| Discounted cash flow: | Outperform |
| DCF, a valuation method used to estimate the value of an investment based on its expected future cash flows. | |
| Return on Assets: | Outperform |
| ROA, indicates how profitable a company is in relation to its total assets, how efficiently uses assets to generate a profit. | |
| Return on Equity: | Underperform |
| ROE, a measure of financial performance calculated by dividing net income by equity. a gauge of profitability and efficiency. | |
| Debt to Equity: | Underperform |
| evaluate financial leverage, reflects the ability of equity to cover outstanding debts in the event of a business downturn. | |
| Stock Basics & Statistics | |
|---|---|
| Exchange: NASDAQ Global Select | |
| Sector: Consumer Cyclical | |
| Industry: Specialty Retail | |
| Shares Out. (M) | 118.49 |
| Shares Float (M) | 117.25 |
| % Held by Insiders | 0.92 |
| % Held by Institutions | 101.48 |
| Shares Short (K) | 15280 |
| Shares Short Prior Month (K) | 16200 |
| Stock Financials | |
|---|---|
| EPS | 2.240 |
| Book Value (p.s.) | -4.570 |
| Profit Margin | 11.19 |
| Operating Margin | 17.00 |
| Return on Assets (ttm) | 8.8 |
| Return on Equity (ttm) | |
| Qtrly Rev. Growth | 4.3 |
| Gross Profit (p.s.) | |
| Sales Per Share | 23.209 |
| EBITDA (p.s.) | 3.652 |
| Qtrly Earnings Growth | -18.00 |
| Operating Cash Flow (M) | 705.51 |
| Levered Free Cash Flow (M) | 561.03 |
| Stock Valuation | |
|---|---|
| PE Ratio | 29.88 |
| PEG Ratio | 1.15 |
| Price to Book value | -14.65 |
| Price to Sales | 2.88 |
| Price to Cash Flow | 11.24 |
| Stock Dividends | |
|---|---|
| Dividend | |
| Dividend Yield | |
| Dividend Growth | |