| Fate Therapeutics (FATE) | |||
|---|---|---|---|
| 4.54 -0.24 (-5.02%) | 04-23 16:00 | ||
| Open: | 4.79 | Pre. Close: | 4.78 |
| High: | 5.02 | Low: | 4.485 |
| Volume: | 3,992,798 | Market Cap: | 517(M) |
| Stock Technical Analysis | |
|---|---|
| Overall: |  |
| Target: | Six months: 7.56 One year: 8.99 |
| Support: | Support1: 4.49 Support2: 3.73 |
| Resistance: | Resistance1: 6.47 Resistance2: 7.70 |
| Pivot: | 5.85 |
| Moving Averages: | MA(5): 4.88 MA(20): 6.16 MA(100): 5.44 MA(250): 4.33 |
| MACD: | MACD(12,26): -0.60 Signal(12,26,9): -0.40 |
| %K %D: | %K(14,3): 3.26 %D(3): 3.13 |
| RSI: | RSI(14): 23.36 |
| 52-Week: | High: 8.83 Low: 1.63 Change(%): -24.7 |
| Average Vol(K): | 3-Month: 2788 10-Days: 2388 |
| Prices Prediction (Update @5:00pm) | ||
|---|---|---|
| If tomorrow: | Open lower | Open higher |
| High: | 5.053 - 5.101 | 5.101 - 5.131 |
| Low: | 4.395 - 4.453 | 4.453 - 4.489 |
| Close: | 4.473 - 4.568 | 4.568 - 4.625 |
| Price, MAs and Bollinger Bands |
|---|
| Price has closed below its short-term moving average. Short-term moving average is currently below mid-term; and below long-term moving average. From the relationship between price and moving averages: This stock is BEARISH in short-term; and NEUTRAL in mid-long term.[ FATE ] has closed above bottom band by 11.2%. Bollinger Bands are 96.1% wider than normal. The large width of the bands suggest high volatility as compared to its normal range. The bands have been in this wide range for 5 days. This is a sign that the current trend might continue. |
| Company profile |
|---|
| Fate Therapeutics, Inc., a clinical-stage biopharmaceutical company, develops programmed cellular immunotherapies for cancer and immune disorders worldwide. Its NK- and T-cell immuno-oncology programs under development include FT516 for the treatment of acute myeloid leukemia (AML) B-cell lymphoma, and advanced solid tumor; FT596 to treat B-cell lymphoma and chronic lymphocytic leukemia; FT538 to treat AML and multiple myeloma; FT576 to treat multiple myeloma; FT819 to treat hematologic malignancies and solid tumors; FT536 to treat solid tumors; and FT500 for the treatment of advanced solid tumors. The company has a collaboration and option agreement with Ono Pharmaceutical Co. Ltd. for the development and commercialization of two off-the-shelf iPSC-derived CAR T-cell product candidates; strategic research collaboration and license agreement with Juno Therapeutics, Inc. to screen for and identify small molecule modulators that enhance the therapeutic properties of genetically-engineered T-cell immunotherapies; and a collaboration and option agreement with Janssen Biotech, Inc. Fate Therapeutics, Inc. was incorporated in 2007 and is headquartered in San Diego, California. |
| Stock chart |
|---|
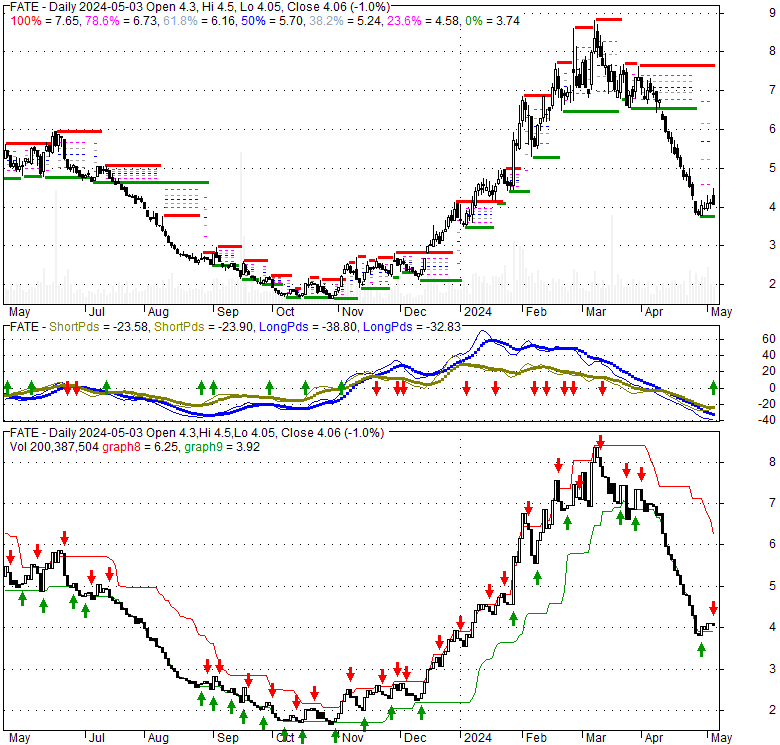 |
| Financial Analysis | |
|---|---|
| Price to Book Value: | Underperform |
| P/BV, a ratio used to compare book value to its current market price, to gauge whether a stock is valued properly. | |
| Price to Earnings: | Underperform |
| PE, the ratio for valuing a company that measures its current share price relative to its earnings per share (EPS). | |
| Discounted cash flow: | Underperform |
| DCF, a valuation method used to estimate the value of an investment based on its expected future cash flows. | |
| Return on Assets: | Underperform |
| ROA, indicates how profitable a company is in relation to its total assets, how efficiently uses assets to generate a profit. | |
| Return on Equity: | Underperform |
| ROE, a measure of financial performance calculated by dividing net income by equity. a gauge of profitability and efficiency. | |
| Debt to Equity: | Outperform |
| evaluate financial leverage, reflects the ability of equity to cover outstanding debts in the event of a business downturn. | |
| Stock Basics & Statistics | |
|---|---|
| Exchange: NASDAQ Global Market | |
| Sector: Healthcare | |
| Industry: Biotechnology | |
| Shares Out. (M) | |
| Shares Float (M) | 113.78 |
| % Held by Insiders | 80710000.00 |
| % Held by Institutions | 1.47 |
| Shares Short (K) | 13490 |
| Shares Short Prior Month (K) | |
| Stock Financials | |
|---|---|
| EPS | -159330000.000 |
| Book Value (p.s.) | |
| Profit Margin | -253.30 |
| Operating Margin | -2.00 |
| Return on Assets (ttm) | 98.8 |
| Return on Equity (ttm) | -18.3 |
| Qtrly Rev. Growth | 63530000.0 |
| Gross Profit (p.s.) | -57.262 |
| Sales Per Share | -22.476 |
| EBITDA (p.s.) | |
| Qtrly Earnings Growth | -1.64 |
| Operating Cash Flow (M) | |
| Levered Free Cash Flow (M) | -132.26 |
| Stock Valuation | |
|---|---|
| PE Ratio | |
| PEG Ratio | 0.07 |
| Price to Book value | |
| Price to Sales | -0.20 |
| Price to Cash Flow | 2.04 |
| Stock Dividends | |
|---|---|
| Dividend | |
| Dividend Yield | |
| Dividend Growth | 16490000.000 |


