| First Republic Bank (FRC) | |||
|---|---|---|---|
| 3.51 0 (0%) | 04-28 16:04 | ||
| Open: | 6.59 | Pre. Close: | 6.19 |
| High: | 6.6 | Low: | 2.985 |
| Volume: | 0 | Market Cap: | 654(M) |
| Stock Technical Analysis | |
|---|---|
| Overall: |  |
| Target: | Six months: 0.40 One year: 0.53 |
| Support: | Support1: 0.16 Support2: 0.13 |
| Resistance: | Resistance1: 0.34 Resistance2: 0.45 |
| Pivot: | 0.22 |
| Moving Averages: | MA(5): 0.20 MA(20): 0.25 MA(100): MA(250): |
| MACD: | MACD(12,26): -1.09 Signal(12,26,9): -1.49 |
| %K %D: | %K(14,3): 32.61 %D(3): 16.10 |
| RSI: | RSI(14): 11.61 |
| 52-Week: | High: 16.36 Low: 0.265 Change(%): -98.2 |
| Average Vol(K): | 3-Month: -10000000000 10-Days: 6919 |
| Prices Prediction (Update @5:00pm) | ||
|---|---|---|
| If tomorrow: | Open lower | Open higher |
| High: | 0.3 - 0.301 | 0.301 - 0.302 |
| Low: | 0.188 - 0.189 | 0.189 - 0.19 |
| Close: | 0.278 - 0.28 | 0.28 - 0.282 |
| Price, MAs and Bollinger Bands |
|---|
| Price has closed above its short-term moving average. Short-term moving average is currently below mid-term; and below long-term moving average. From the relationship between price and moving averages: This stock is NEUTRAL in short-term; and NEUTRAL in mid-long term.[ FRC ] has closed below upper band by 13.4%. Bollinger Bands are 0% narrower than normal. |
| Company profile |
|---|
| First Republic Bank, together with its subsidiaries, provides private banking, private business banking, and private wealth management services to clients in metropolitan areas in the United States. It operates in two segments, Commercial Banking and Wealth Management. The company accepts deposit products, such as noninterest-bearing checking, interest-bearing checking, money market checking accounts, money market savings accounts, and passbook accounts, as well as certificates of deposit. It also offers a range of lending products that comprise residential mortgage loans, home equity lines of credit, multifamily loans, commercial real estate and construction loans, personal and business loans, single family construction loans, and other loans and lines of credit to businesses and individuals. The company's loans are secured by single family residences, multifamily buildings, and commercial real estate properties. In addition, it provides wealth management services, which include various investment strategies and products, online investment management, trust and custody, full service and online brokerage, financial and estate planning, and access to alternative investments, as well as investing, insurance, and foreign exchange services. Further, the company offers online and mobile banking services; refinancing services; and ATM and debit cards. As of December 31, 2021, it offered its services through 82 licensed deposit taking offices primarily in the San Francisco, Palo Alto, Los Angeles, Santa Barbara, Newport Beach and San Diego, California; Portland, Oregon; Boston, Massachusetts; Palm Beach, Florida; Greenwich, Connecticut; New York, New York; and Jackson, Wyoming. It also has 12 additional offices that offer lending, wealth management, or trust services. First Republic Bank was founded in 1985 and is headquartered in San Francisco, California. |
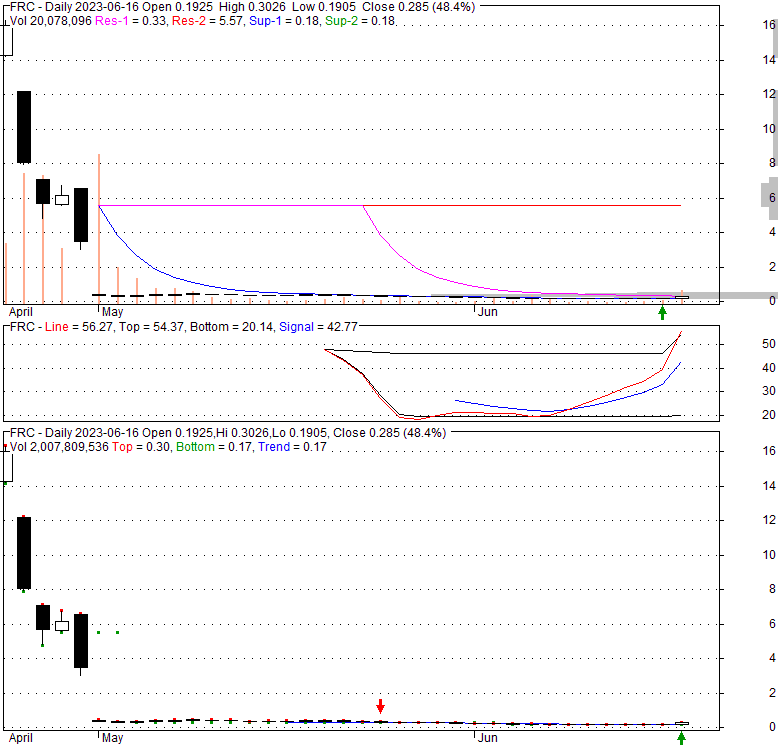
| Stock chart |
|---|
 |
| Financial Analysis | |
|---|---|
| Price to Book Value: | Outperform |
| P/BV, a ratio used to compare book value to its current market price, to gauge whether a stock is valued properly. | |
| Price to Earnings: | Outperform |
| PE, the ratio for valuing a company that measures its current share price relative to its earnings per share (EPS). | |
| Discounted cash flow: | Outperform |
| DCF, a valuation method used to estimate the value of an investment based on its expected future cash flows. | |
| Return on Assets: | Underperform |
| ROA, indicates how profitable a company is in relation to its total assets, how efficiently uses assets to generate a profit. | |
| Return on Equity: | Neutral |
| ROE, a measure of financial performance calculated by dividing net income by equity. a gauge of profitability and efficiency. | |
| Debt to Equity: | Outperform |
| evaluate financial leverage, reflects the ability of equity to cover outstanding debts in the event of a business downturn. | |
| Stock Basics & Statistics | |
|---|---|
| Exchange: New York Stock Exchange | |
| Sector: Financial Services | |
| Industry: Banks - Regional | |
| Shares Out. (M) | 186.22 |
| Shares Float (M) | 183.74 |
| % Held by Insiders | 0.68 |
| % Held by Institutions | 94.15 |
| Shares Short (K) | 56010 |
| Shares Short Prior Month (K) | 8990 |
| Stock Financials | |
|---|---|
| EPS | 8.250 |
| Book Value (p.s.) | 77.610 |
| Profit Margin | 27.55 |
| Operating Margin | 37.45 |
| Return on Assets (ttm) | 0.7 |
| Return on Equity (ttm) | 9.0 |
| Qtrly Rev. Growth | -13.9 |
| Gross Profit (p.s.) | 30.931 |
| Sales Per Share | 29.911 |
| EBITDA (p.s.) | |
| Qtrly Earnings Growth | -38.50 |
| Operating Cash Flow (M) | |
| Levered Free Cash Flow (M) | |
| Stock Valuation | |
|---|---|
| PE Ratio | 0.03 |
| PEG Ratio | 0.04 |
| Price to Book value | |
| Price to Sales | 0.01 |
| Price to Cash Flow | |
| Stock Dividends | |
|---|---|
| Dividend | 0.270 |
| Dividend Yield | 0.95 |
| Dividend Growth | |