| Graphic Packaging Holding Company (GPK) | |||
|---|---|---|---|
| 27.35 0.14 (0.51%) | 04-19 16:00 | ||
| Open: | 27.18 | Pre. Close: | 27.21 |
| High: | 27.37 | Low: | 27.005 |
| Volume: | 2,028,108 | Market Cap: | 8,404(M) |
| Stock Technical Analysis | |
|---|---|
| Overall: |  |
| Target: | Six months: 33.22 One year: 34.46 |
| Support: | Support1: 26.74 Support2: 22.25 |
| Resistance: | Resistance1: 28.45 Resistance2: 29.50 |
| Pivot: | 28.16 |
| Moving Averages: | MA(5): 27.33 MA(20): 28.32 MA(100): 25.88 MA(250): 24.33 |
| MACD: | MACD(12,26): 0.02 Signal(12,26,9): 0.28 |
| %K %D: | %K(14,3): 10.15 %D(3): 7.82 |
| RSI: | RSI(14): 44.62 |
| 52-Week: | High: 29.5 Low: 20.07 Change(%): 12.0 |
| Average Vol(K): | 3-Month: 2796 10-Days: 2078 |
| Prices Prediction (Update @5:00pm) | ||
|---|---|---|
| If tomorrow: | Open lower | Open higher |
| High: | 27.417 - 27.548 | 27.548 - 27.666 |
| Low: | 26.671 - 26.827 | 26.827 - 26.968 |
| Close: | 27.096 - 27.349 | 27.349 - 27.58 |
| Price, MAs and Bollinger Bands |
|---|
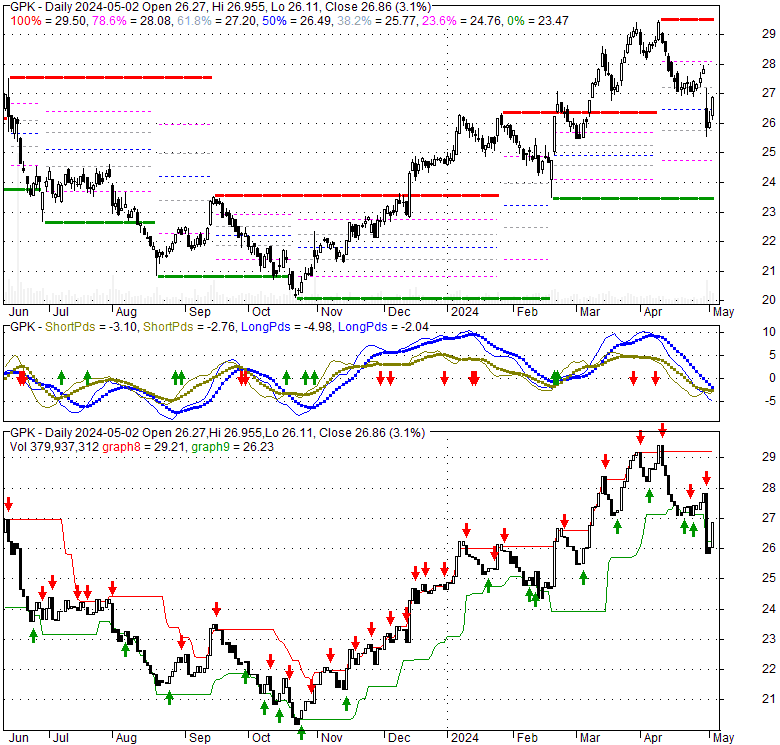
| Price has closed above its short-term moving average. Short-term moving average is currently below mid-term; and above long-term moving average. From the relationship between price and moving averages: This stock is NEUTRAL in short-term; and NEUTRAL in mid-long term.[ GPK ] has closed above bottom band by 20.2%. Bollinger Bands are 20.6% wider than normal. The current width of the bands does not suggest anything about the future direction or movement of prices. |
| Company profile |
|---|
| Graphic Packaging Holding Company, together with its subsidiaries, provides fiber-based packaging solutions to food, beverage, foodservice, and other consumer products companies. It operates through three segments: Paperboard Mills, Americas Paperboard Packaging, and Europe Paperboard Packaging. The company offers coated unbleached kraft (CUK), coated recycled paperboard (CRB), and solid bleached sulfate paperboard (SBS) to various paperboard packaging converters and brokers; and paperboard packaging products, such as folding cartons, cups, lids, and food containers primarily to consumer packaged goods, quick-service restaurants, and foodservice companies; and barrier packaging products that protect against moisture, hot and cold temperature, grease, oil, oxygen, sunlight, insects, and other potential product-damaging factors. It also offers various laminated, coated, and printed packaging structures that are produced from its CUK, CRB, and SBS, as well as other grades of paperboards that are purchased from third-party suppliers; designs and manufactures specialized packaging machines that package bottles and cans, and non-beverage consumer products; and installs its packaging machines at customer plants and provides support, service, and performance monitoring of the machines. The company markets its products primarily through sales offices and broker arrangements with third parties in the Americas, Europe, and the Asia Pacific. Graphic Packaging Holding Company was incorporated in 2007 and is headquartered in Atlanta, Georgia. |
| Stock chart |
|---|
 |
| Financial Analysis | |
|---|---|
| Price to Book Value: | Outperform |
| P/BV, a ratio used to compare book value to its current market price, to gauge whether a stock is valued properly. | |
| Price to Earnings: | Neutral |
| PE, the ratio for valuing a company that measures its current share price relative to its earnings per share (EPS). | |
| Discounted cash flow: | Neutral |
| DCF, a valuation method used to estimate the value of an investment based on its expected future cash flows. | |
| Return on Assets: | Outperform |
| ROA, indicates how profitable a company is in relation to its total assets, how efficiently uses assets to generate a profit. | |
| Return on Equity: | Outperform |
| ROE, a measure of financial performance calculated by dividing net income by equity. a gauge of profitability and efficiency. | |
| Debt to Equity: | Outperform |
| evaluate financial leverage, reflects the ability of equity to cover outstanding debts in the event of a business downturn. | |
| Stock Basics & Statistics | |
|---|---|
| Exchange: New York Stock Exchange | |
| Sector: Consumer Cyclical | |
| Industry: Packaging & Containers | |
| Shares Out. (M) | 307.29 |
| Shares Float (M) | 301.69 |
| % Held by Insiders | 1.29 |
| % Held by Institutions | 103.38 |
| Shares Short (K) | 12960 |
| Shares Short Prior Month (K) | 11720 |
| Stock Financials | |
|---|---|
| EPS | 2.340 |
| Book Value (p.s.) | 9.090 |
| Profit Margin | 7.67 |
| Operating Margin | 14.23 |
| Return on Assets (ttm) | 7.5 |
| Return on Equity (ttm) | 29.3 |
| Qtrly Rev. Growth | -5.7 |
| Gross Profit (p.s.) | |
| Sales Per Share | 30.688 |
| EBITDA (p.s.) | 6.085 |
| Qtrly Earnings Growth | 26.00 |
| Operating Cash Flow (M) | 1140.00 |
| Levered Free Cash Flow (M) | 303.75 |
| Stock Valuation | |
|---|---|
| PE Ratio | 11.69 |
| PEG Ratio | 0.42 |
| Price to Book value | 3.01 |
| Price to Sales | 0.89 |
| Price to Cash Flow | 7.37 |
| Stock Dividends | |
|---|---|
| Dividend | |
| Dividend Yield | |
| Dividend Growth | |