| Hawaiian Hlds Inc (HA) | |||
|---|---|---|---|
| 12.97 0.02 (0.15%) | 04-22 16:00 | ||
| Open: | 12.98 | Pre. Close: | 12.95 |
| High: | 13.035 | Low: | 12.8201 |
| Volume: | 397,110 | Market Cap: | 672(M) |
| Stock Technical Analysis | |
|---|---|
| Overall: |  |
| Target: | Six months: 15.68 One year: 16.34 |
| Support: | Support1: 12.51 Support2: 10.41 |
| Resistance: | Resistance1: 13.42 Resistance2: 13.99 |
| Pivot: | 13.16 |
| Moving Averages: | MA(5): 13.08 MA(20): 13.21 MA(100): 13.42 MA(250): 10.13 |
| MACD: | MACD(12,26): -0.16 Signal(12,26,9): -0.15 |
| %K %D: | %K(14,3): 43.04 %D(3): 45.81 |
| RSI: | RSI(14): 38.11 |
| 52-Week: | High: 14.89 Low: 3.7 Change(%): 55.1 |
| Average Vol(K): | 3-Month: 712 10-Days: 681 |
| Prices Prediction (Update @5:00pm) | ||
|---|---|---|
| If tomorrow: | Open lower | Open higher |
| High: | 13.049 - 13.122 | 13.122 - 13.189 |
| Low: | 12.625 - 12.722 | 12.722 - 12.81 |
| Close: | 12.83 - 12.97 | 12.97 - 13.098 |
| Price, MAs and Bollinger Bands |
|---|
| Price has closed below its short-term moving average. Short-term moving average is currently below mid-term; and below long-term moving average. From the relationship between price and moving averages: This stock is BEARISH in short-term; and NEUTRAL in mid-long term.[ HA ] has closed above bottom band by 12.9%. Bollinger Bands are 82.5% narrower than normal. The narrow width of the bands suggests low volatility as compared to its normal range. The bands have been in this narrow range for 81 bars. This is a sign that the market may be about to initiate a new trend. |
| Company profile |
|---|
| Hawaiian Holdings, Inc., through its subsidiary, Hawaiian Airlines, Inc., engages in the scheduled air transportation of passengers and cargo. The company provides daily services on North America routes between the State of Hawai'i and Long Beach, Los Angeles, Oakland, Sacramento, San Diego, San Francisco, and San Jose, California; Las Vegas, Nevada; Seattle, Washington; Portland, Oregon; Phoenix, Arizona; and New York City, New York. It also offers scheduled service between the State of Hawai'i and Austin, Texas; Boston, Massachusetts; Orlando, Florida; and Pago Pago, American Samoa. In addition, the company provides daily service on its Neighbor Island routes among the four major islands of the State of Hawai'i. Further, it offers scheduled service on its international routes between the State of Hawai'i and Tokyo (Narita), Japan, Osaka, Japan; Sydney, Australia; Papeete, Tahiti; and Seoul, South Korea, as well as operates various ad hoc charters. Hawaiian Holdings, Inc. distributes its tickets through various distribution channels, including its website hawaiianairlines.com primarily for North America and Neighbor Island routes, as well as through travel agencies and wholesale distributors for its international routes. As of December 31, 2021, the company's fleet consisted of 19 Boeing 717-200 aircraft for the Neighbor Island routes; 24 Airbus A330-200 aircraft; and 18 Airbus A321neo for the North America and international routes. Hawaiian Holdings, Inc. was incorporated in 1929 and is headquartered in Honolulu, Hawaii. |
| Stock chart |
|---|
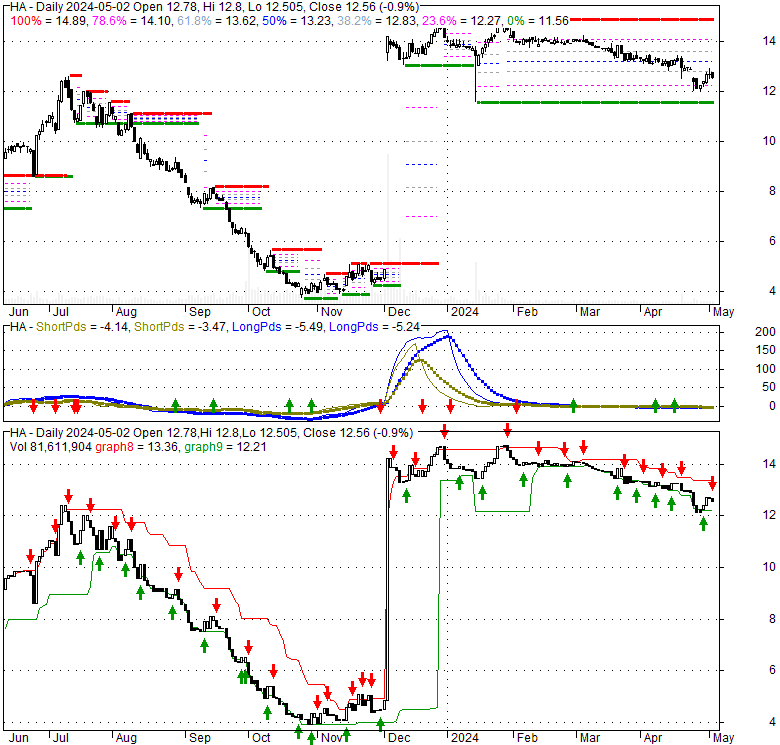 |
| Financial Analysis | |
|---|---|
| Price to Book Value: | Outperform |
| P/BV, a ratio used to compare book value to its current market price, to gauge whether a stock is valued properly. | |
| Price to Earnings: | Underperform |
| PE, the ratio for valuing a company that measures its current share price relative to its earnings per share (EPS). | |
| Discounted cash flow: | Outperform |
| DCF, a valuation method used to estimate the value of an investment based on its expected future cash flows. | |
| Return on Assets: | Underperform |
| ROA, indicates how profitable a company is in relation to its total assets, how efficiently uses assets to generate a profit. | |
| Return on Equity: | Underperform |
| ROE, a measure of financial performance calculated by dividing net income by equity. a gauge of profitability and efficiency. | |
| Debt to Equity: | Outperform |
| evaluate financial leverage, reflects the ability of equity to cover outstanding debts in the event of a business downturn. | |
| Stock Basics & Statistics | |
|---|---|
| Exchange: NASDAQ Global Select | |
| Sector: Industrials | |
| Industry: Airlines, Airports & Air Services | |
| Shares Out. (M) | 51.85 |
| Shares Float (M) | 47.64 |
| % Held by Insiders | 2.96 |
| % Held by Institutions | 74.99 |
| Shares Short (K) | 6050 |
| Shares Short Prior Month (K) | 6100 |
| Stock Financials | |
|---|---|
| EPS | -5.050 |
| Book Value (p.s.) | 1.840 |
| Profit Margin | -9.59 |
| Operating Margin | -22.81 |
| Return on Assets (ttm) | -5.5 |
| Return on Equity (ttm) | -121.5 |
| Qtrly Rev. Growth | -8.5 |
| Gross Profit (p.s.) | |
| Sales Per Share | 52.459 |
| EBITDA (p.s.) | -4.365 |
| Qtrly Earnings Growth | |
| Operating Cash Flow (M) | -160.00 |
| Levered Free Cash Flow (M) | -326.21 |
| Stock Valuation | |
|---|---|
| PE Ratio | -2.57 |
| PEG Ratio | 0.03 |
| Price to Book value | 7.05 |
| Price to Sales | 0.25 |
| Price to Cash Flow | -4.20 |
| Stock Dividends | |
|---|---|
| Dividend | 0.120 |
| Dividend Yield | 0.01 |
| Dividend Growth | |


