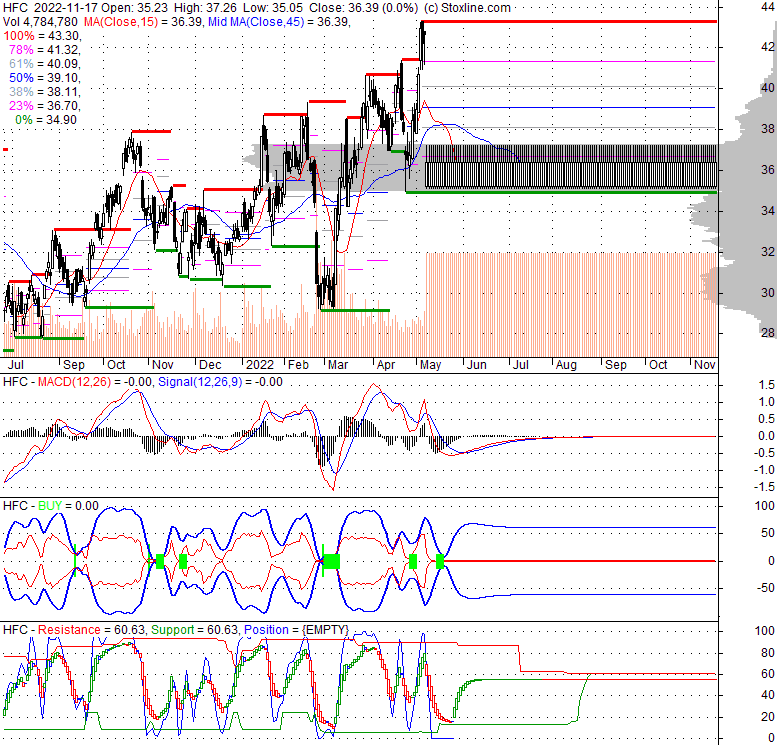
| Hollyfrontier Corp (HFC) | |||
|---|---|---|---|
| 36.39 0.71 (1.99%) | 03-15 00:00 | ||
| Open: | 35.23 | Pre. Close: | 35.68 |
| High: | 37.26 | Low: | 35.05 |
| Volume: | 4,784,780 | Market Cap: | 7,139(M) |
| Stock Technical Analysis | |
|---|---|
| Overall: |  |
| Target: | Six months: 43.52 One year: 50.83 |
| Support: | Support1: 35.89 Support2: 35.05 |
| Resistance: | Resistance1: 37.26 Resistance2: 43.52 |
| Pivot: | 36.39 |
| Moving Averages: | MA(5): 36.39 MA(20): 36.39 MA(100): 36.39 MA(250): 35.95 |
| MACD: | MACD(12,26): Signal(12,26,9): |
| %K %D: | %K(14,3): 60.63 %D(3): 60.63 |
| RSI: | RSI(14): 42.87 |
| 52-Week: | High: 39.39 Low: 27.165 Change(%): 7.2 |
| Average Vol(K): | 3-Month: 4785 10-Days: 4785 |
| Prices Prediction (Update @5:00pm) | ||
|---|---|---|
| If tomorrow: | Open lower | Open higher |
| High: | 37.347 - 37.531 | 37.531 - 37.68 |
| Low: | 34.559 - 34.801 | 34.801 - 34.996 |
| Close: | 36.043 - 36.418 | 36.418 - 36.722 |
| Price, MAs and Bollinger Bands |
|---|
| Price has closed below its short-term moving average. Short-term moving average is currently below mid-term; and below long-term moving average. From the relationship between price and moving averages: This stock is NEUTRAL in short-term; and NEUTRAL in mid-long term.[ HFC ] has closed Bollinger Bands are 0% narrower than normal. |
| Company profile |
|---|
| HollyFrontier Corporation operates as an independent petroleum refiner and marketer in the United States. The company operates through three segments: Refining, Lubricants and Specialty Products, and HEP. It primarily produces high-value light products, such as gasoline, diesel and jet fuel, and specialty lubricant products, as well as specialty and modified asphalt. The company offers its products to other refiners, convenience store chains, independent marketers, liquid petroleum gases and other retailers, truck stop chains, wholesalers, railroads, governmental entities, and paving contractors or manufacturers, as well as for commercial airline use. It owns and operates five refineries with a combined crude oil processing capacity of approximately 554,000 barrels per day in El Dorado, Kansas; Tulsa, Oklahoma; Anacortes, Washington; Artesia, New Mexico; and Woods Cross, Utah. The company also owns and operates vacuum distillation and other facilities in Lovington, New Mexico, as well as asphalt terminals in Arizona, New Mexico, and Oklahoma. Its refineries serve markets in the Mid-Continent, Southwest, and Rocky Mountain regions of the United States. In addition, the company produces base oils and other specialized lubricant products; and owns and operates logistic assets consisting of petroleum product and crude oil pipelines, terminals, tankage, loading rack facilities, and refinery processing units. The company was formerly known as Holly Corporation and changed its name to HollyFrontier Corporation as a result of its merger with Frontier Oil Corporation in July 2011. HollyFrontier Corporation was incorporated in 1947 and is headquartered in Dallas, Texas. |
| Stock chart |
|---|
 |
| Financial Analysis | |
|---|---|
| Price to Book Value: | Outperform |
| P/BV, a ratio used to compare book value to its current market price, to gauge whether a stock is valued properly. | |
| Price to Earnings: | Underperform |
| PE, the ratio for valuing a company that measures its current share price relative to its earnings per share (EPS). | |
| Discounted cash flow: | Outperform |
| DCF, a valuation method used to estimate the value of an investment based on its expected future cash flows. | |
| Return on Assets: | Neutral |
| ROA, indicates how profitable a company is in relation to its total assets, how efficiently uses assets to generate a profit. | |
| Return on Equity: | Neutral |
| ROE, a measure of financial performance calculated by dividing net income by equity. a gauge of profitability and efficiency. | |
| Debt to Equity: | Outperform |
| evaluate financial leverage, reflects the ability of equity to cover outstanding debts in the event of a business downturn. | |
| Stock Basics & Statistics | |
|---|---|
| Exchange: New York Stock Exchange | |
| Sector: Energy | |
| Industry: Oil & Gas Refining & Marketing | |
| Shares Out. (M) | 162.50 |
| Shares Float (M) | 160.02 |
| % Held by Insiders | 0.64 |
| % Held by Institutions | 89.21 |
| Shares Short (K) | 6690 |
| Shares Short Prior Month (K) | 6530 |
| Stock Financials | |
|---|---|
| EPS | 2.900 |
| Book Value (p.s.) | 35.640 |
| Profit Margin | 3.06 |
| Operating Margin | 4.99 |
| Return on Assets (ttm) | 4.0 |
| Return on Equity (ttm) | 9.6 |
| Qtrly Rev. Growth | 66.2 |
| Gross Profit (p.s.) | 3.999 |
| Sales Per Share | 96.431 |
| EBITDA (p.s.) | 6.892 |
| Qtrly Earnings Growth | |
| Operating Cash Flow (M) | 806.37 |
| Levered Free Cash Flow (M) | -4.00 |
| Stock Valuation | |
|---|---|
| PE Ratio | 12.55 |
| PEG Ratio | -2.23 |
| Price to Book value | 1.02 |
| Price to Sales | 0.38 |
| Price to Cash Flow | 7.33 |
| Stock Dividends | |
|---|---|
| Dividend | |
| Dividend Yield | |
| Dividend Growth | |