| Jakks Pacific Inc (JAKK) | |||
|---|---|---|---|
| 23.46 0.68 (2.99%) | 04-24 16:00 | ||
| Open: | 22.84 | Pre. Close: | 22.78 |
| High: | 23.76 | Low: | 22.795 |
| Volume: | 110,435 | Market Cap: | 253(M) |
| Stock Technical Analysis | |
|---|---|
| Overall: |  |
| Target: | Six months: 28.14 One year: 29.81 |
| Support: | Support1: 21.79 Support2: 18.13 |
| Resistance: | Resistance1: 24.10 Resistance2: 25.52 |
| Pivot: | 22.62 |
| Moving Averages: | MA(5): 22.69 MA(20): 22.85 MA(100): 29.51 MA(250): 24.36 |
| MACD: | MACD(12,26): -0.73 Signal(12,26,9): -1.02 |
| %K %D: | %K(14,3): 57.95 %D(3): 40.33 |
| RSI: | RSI(14): 49.02 |
| 52-Week: | High: 36.84 Low: 15.3 Change(%): 13.4 |
| Average Vol(K): | 3-Month: 117 10-Days: 88 |
| Prices Prediction (Update @5:00pm) | ||
|---|---|---|
| If tomorrow: | Open lower | Open higher |
| High: | 23.789 - 23.877 | 23.877 - 23.948 |
| Low: | 22.566 - 22.675 | 22.675 - 22.763 |
| Close: | 23.293 - 23.465 | 23.465 - 23.602 |
| Price, MAs and Bollinger Bands |
|---|
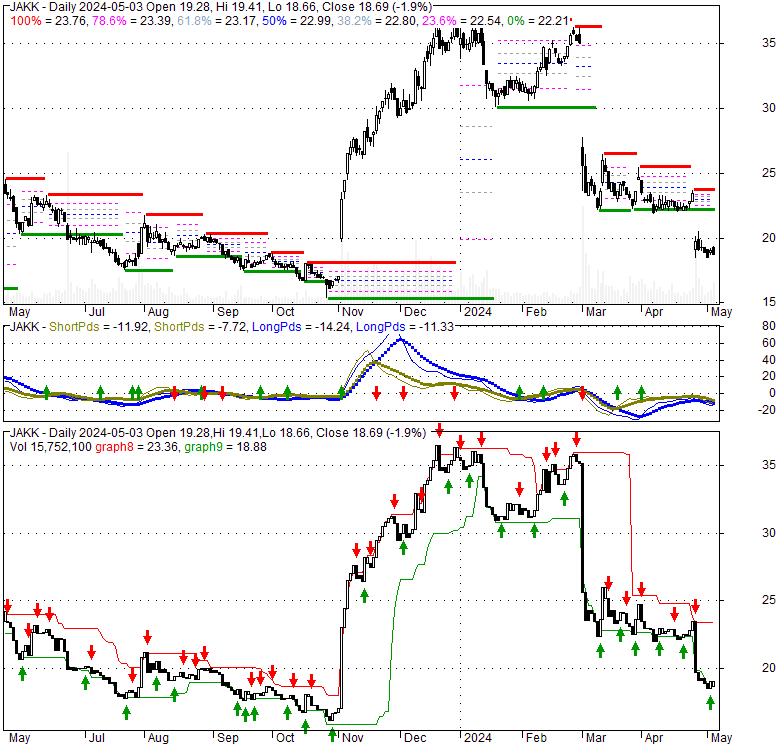
| Price has closed above its short-term moving average. Short-term moving average is currently below mid-term; and below long-term moving average. From the relationship between price and moving averages: This stock is NEUTRAL in short-term; and BEARISH in mid-long term.[ JAKK ] has closed It is unclear right now based on current values. 77.3% narrower than normal. The narrow width of the bands suggests low volatility as compared to its normal range. The bands have been in this narrow range for 23 bars. This is a sign that the market may be about to initiate a new trend. |
| Company profile |
|---|
| JAKKS Pacific, Inc. develops, produces, markets, sells, and distributes toys, consumables, and electronics and related products worldwide. It operates in two segments, Toys/Consumer Products and Costumes. The company offers action figures and accessories, such as licensed characters; toy vehicles and accessories; dolls and accessories, including small, large, fashion, and baby dolls based on licenses, as well as infant and pre-school products; private label products; and foot-to-floor ride-on products, inflatable environments, tents, and wagons. The company also provides role play, dress-up, pretend play, and novelty products for boys and girls based on brands and entertainment properties, as well as on its own proprietary brands; and indoor and outdoor kids' furniture, activity trays and tables, room décor, kiddie pools, and seasonal and outdoor products. In addition, it offers Halloween and everyday costumes for various ages based on licensed and proprietary non-licensed brands, and related Halloween accessories; outdoor activity toys; and junior sports toys, including hyper-charged balls, sport sets, and toy hoops. The company sells its products through in-house sales staff and independent sales representatives to toy and mass-market retail chain stores, department stores, office supply stores, drug and grocery store chains, club stores, value-oriented dollar stores, toy specialty stores, and wholesalers. JAKKS Pacific, Inc. was incorporated in 1995 and is headquartered in Santa Monica, California. |
| Stock chart |
|---|
 |
| Financial Analysis | |
|---|---|
| Price to Book Value: | Outperform |
| P/BV, a ratio used to compare book value to its current market price, to gauge whether a stock is valued properly. | |
| Price to Earnings: | Underperform |
| PE, the ratio for valuing a company that measures its current share price relative to its earnings per share (EPS). | |
| Discounted cash flow: | Outperform |
| DCF, a valuation method used to estimate the value of an investment based on its expected future cash flows. | |
| Return on Assets: | Underperform |
| ROA, indicates how profitable a company is in relation to its total assets, how efficiently uses assets to generate a profit. | |
| Return on Equity: | Underperform |
| ROE, a measure of financial performance calculated by dividing net income by equity. a gauge of profitability and efficiency. | |
| Debt to Equity: | Underperform |
| evaluate financial leverage, reflects the ability of equity to cover outstanding debts in the event of a business downturn. | |
| Stock Basics & Statistics | |
|---|---|
| Exchange: NASDAQ Global Select | |
| Sector: Consumer Cyclical | |
| Industry: Leisure | |
| Shares Out. (M) | 10.80 |
| Shares Float (M) | 7.92 |
| % Held by Insiders | 26.84 |
| % Held by Institutions | 46.26 |
| Shares Short (K) | 311 |
| Shares Short Prior Month (K) | 226 |
| Stock Financials | |
|---|---|
| EPS | 3.480 |
| Book Value (p.s.) | 18.760 |
| Profit Margin | 5.40 |
| Operating Margin | -12.04 |
| Return on Assets (ttm) | 9.2 |
| Return on Equity (ttm) | 22.0 |
| Qtrly Rev. Growth | -3.4 |
| Gross Profit (p.s.) | |
| Sales Per Share | 65.885 |
| EBITDA (p.s.) | 6.268 |
| Qtrly Earnings Growth | |
| Operating Cash Flow (M) | 66.40 |
| Levered Free Cash Flow (M) | 49.18 |
| Stock Valuation | |
|---|---|
| PE Ratio | 6.74 |
| PEG Ratio | 0.45 |
| Price to Book value | 1.25 |
| Price to Sales | 0.36 |
| Price to Cash Flow | 3.82 |
| Stock Dividends | |
|---|---|
| Dividend | 0.700 |
| Dividend Yield | 0.03 |
| Dividend Growth | |