| Kohls Corp (KSS) | |||
|---|---|---|---|
| 23.19 0.34 (1.49%) | 04-19 16:00 | ||
| Open: | 22.73 | Pre. Close: | 22.85 |
| High: | 23.34 | Low: | 22.63 |
| Volume: | 4,807,015 | Market Cap: | 2,572(M) |
| Stock Technical Analysis | |
|---|---|
| Overall: |  |
| Target: | Six months: 30.93 One year: 34.57 |
| Support: | Support1: 21.43 Support2: 17.83 |
| Resistance: | Resistance1: 26.48 Resistance2: 29.60 |
| Pivot: | 24.43 |
| Moving Averages: | MA(5): 22.43 MA(20): 25.16 MA(100): 26.33 MA(250): 24.34 |
| MACD: | MACD(12,26): -1.17 Signal(12,26,9): -0.90 |
| %K %D: | %K(14,3): 14.14 %D(3): 8.30 |
| RSI: | RSI(14): 39.98 |
| 52-Week: | High: 29.65 Low: 17.68 Change(%): 0.1 |
| Average Vol(K): | 3-Month: 5397 10-Days: 5796 |
| Prices Prediction (Update @5:00pm) | ||
|---|---|---|
| If tomorrow: | Open lower | Open higher |
| High: | 23.38 - 23.491 | 23.491 - 23.593 |
| Low: | 22.355 - 22.485 | 22.485 - 22.603 |
| Close: | 22.974 - 23.189 | 23.189 - 23.385 |
| Price, MAs and Bollinger Bands |
|---|
| Price has closed above its short-term moving average. Short-term moving average is currently below mid-term; and below long-term moving average. From the relationship between price and moving averages: This stock is NEUTRAL in short-term; and BEARISH in mid-long term.[ KSS ] has closed above bottom band by 35.6%. Bollinger Bands are 81.6% wider than normal. The large width of the bands suggest high volatility as compared to its normal range. The bands have been in this wide range for 7 days. This is a sign that the current trend might continue. |
| Company profile |
|---|
| Kohl's Corporation operates as a retail company in the United States. It offers branded apparel, footwear, accessories, beauty, and home products through its stores and website. The company provides its products primarily under the brand names of Apt. 9, Croft & Barrow, Jumping Beans, SO, and Sonoma Goods for Life, as well as Food Network, LC Lauren Conrad, Nine West, and Simply Vera Vera Wang. As of March 21, 2022, it operated approximately 1,100 Kohl's stores and a website www.Kohls.com. Kohl's Corporation was founded in 1988 and is headquartered in Menomonee Falls, Wisconsin. |
| Stock chart |
|---|
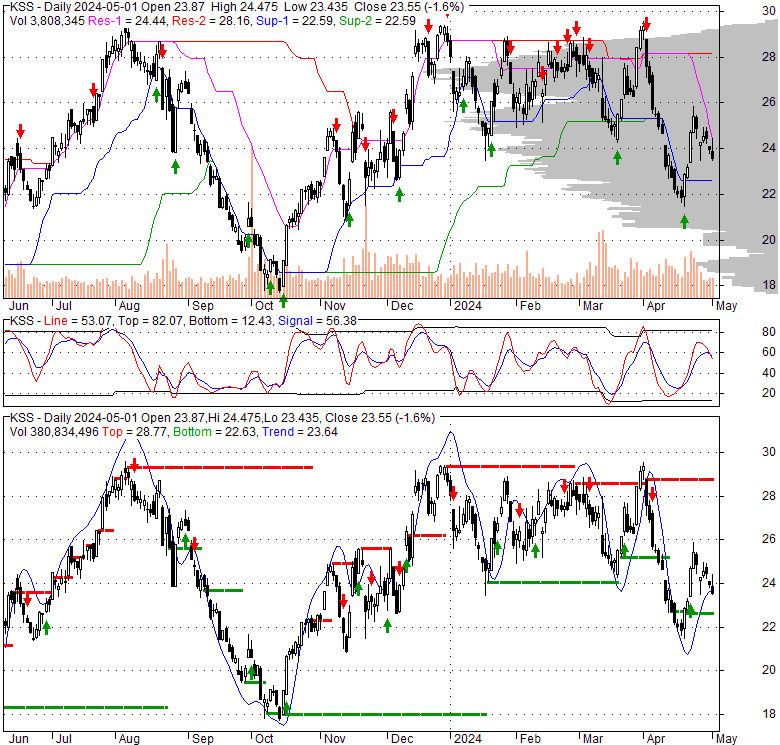 |
| Financial Analysis | |
|---|---|
| Price to Book Value: | Underperform |
| P/BV, a ratio used to compare book value to its current market price, to gauge whether a stock is valued properly. | |
| Price to Earnings: | Underperform |
| PE, the ratio for valuing a company that measures its current share price relative to its earnings per share (EPS). | |
| Discounted cash flow: | Outperform |
| DCF, a valuation method used to estimate the value of an investment based on its expected future cash flows. | |
| Return on Assets: | Outperform |
| ROA, indicates how profitable a company is in relation to its total assets, how efficiently uses assets to generate a profit. | |
| Return on Equity: | Outperform |
| ROE, a measure of financial performance calculated by dividing net income by equity. a gauge of profitability and efficiency. | |
| Debt to Equity: | Neutral |
| evaluate financial leverage, reflects the ability of equity to cover outstanding debts in the event of a business downturn. | |
| Stock Basics & Statistics | |
|---|---|
| Exchange: New York Stock Exchange | |
| Sector: Consumer Cyclical | |
| Industry: Department Stores | |
| Shares Out. (M) | 110.91 |
| Shares Float (M) | 109.29 |
| % Held by Insiders | 1.46 |
| % Held by Institutions | 126.78 |
| Shares Short (K) | 29910 |
| Shares Short Prior Month (K) | 27710 |
| Stock Financials | |
|---|---|
| EPS | 2.850 |
| Book Value (p.s.) | 35.070 |
| Profit Margin | 1.81 |
| Operating Margin | 5.02 |
| Return on Assets (ttm) | 3.2 |
| Return on Equity (ttm) | 8.3 |
| Qtrly Rev. Growth | |
| Gross Profit (p.s.) | |
| Sales Per Share | 157.605 |
| EBITDA (p.s.) | 13.254 |
| Qtrly Earnings Growth | |
| Operating Cash Flow (M) | 1170.00 |
| Levered Free Cash Flow (M) | 588.12 |
| Stock Valuation | |
|---|---|
| PE Ratio | 8.14 |
| PEG Ratio | -0.57 |
| Price to Book value | 0.66 |
| Price to Sales | 0.15 |
| Price to Cash Flow | 2.20 |
| Stock Dividends | |
|---|---|
| Dividend | |
| Dividend Yield | |
| Dividend Growth | |


