| Live Nation Entertainment (LYV) | |||
|---|---|---|---|
| 89.6683 -0.422 (-0.47%) | 04-24 15:59 | ||
| Open: | 90 | Pre. Close: | 90.09 |
| High: | 90.605 | Low: | 89.33 |
| Volume: | 980,192 | Market Cap: | 20,695(M) |
| Stock Technical Analysis | |
|---|---|
| Overall: |  |
| Target: | Six months: 116.74 One year: 125.26 |
| Support: | Support1: 88.15 Support2: 73.34 |
| Resistance: | Resistance1: 99.95 Resistance2: 107.24 |
| Pivot: | 96.54 |
| Moving Averages: | MA(5): 89.54 MA(20): 98.70 MA(100): 94.00 MA(250): 88.47 |
| MACD: | MACD(12,26): -3.16 Signal(12,26,9): -1.62 |
| %K %D: | %K(14,3): 7.19 %D(3): 5.10 |
| RSI: | RSI(14): 29.69 |
| 52-Week: | High: 107.24 Low: 64.96 Change(%): 36.9 |
| Average Vol(K): | 3-Month: 2400 10-Days: 3029 |
| Prices Prediction (Update @5:00pm) | ||
|---|---|---|
| If tomorrow: | Open lower | Open higher |
| High: | 92.16 - 92.81 | 92.81 - 93.314 |
| Low: | 87.266 - 87.943 | 87.943 - 88.469 |
| Close: | 89.204 - 90.254 | 90.254 - 91.069 |
| Price, MAs and Bollinger Bands |
|---|
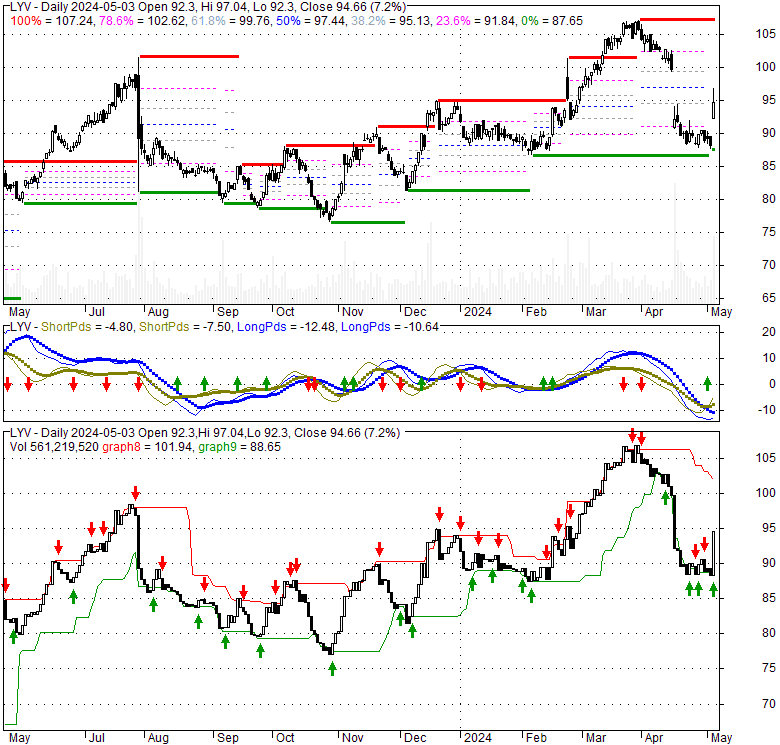
| Price has closed above its short-term moving average. Short-term moving average is currently below mid-term; and below long-term moving average. From the relationship between price and moving averages: This stock is NEUTRAL in short-term; and NEUTRAL in mid-long term.[ LYV ] has closed above bottom band by 21.0%. Bollinger Bands are 158.9% wider than normal. The large width of the bands suggest high volatility as compared to its normal range. The bands have been in this wide range for 6 days. This is a sign that the current trend might continue. |
| Company profile |
|---|
| Live Nation Entertainment, Inc. operates as a live entertainment company. It operates through Concerts, Ticketing, and Sponsorship & Advertising segments. The Concerts segment promotes live music events in its owned or operated venues, and in rented third-party venues; operates and manages music venues; produces music festivals; creates associated content; and offers management and other services to artists. The Ticketing segment manages the ticketing operations, including the provision of ticketing software and services to clients for tickets and event information through its primary websites livenation.com and ticketmaster.com, as well as provides ticket resale services. This segment sells tickets for its events, as well as for third-party clients in various live event categories, such as arenas, stadiums, amphitheaters, music clubs, concert promoters, professional sports franchises and leagues, college sports teams, performing arts venues, museums, and theaters through websites, mobile apps, and ticket outlets. The Sponsorship & Advertising segment sells international, national, and local sponsorships and placement of advertising, including signage, promotional programs, rich media offering that comprise advertising related with live streaming and music-related content; and ads across its distribution network of venues, events, and websites. This segment also manages the development of strategic sponsorship programs, as well as develops, books, and produces custom events or programs for specific brands. As of December 31, 2021, it owned, operated, or leased 165 entertainment venues in North America and 94 entertainment venues internationally. The company was formerly known as Live Nation, Inc. and changed its name to Live Nation Entertainment, Inc. in January 2010. Live Nation Entertainment, Inc. was incorporated in 2005 and is headquartered in Beverly Hills, California. |
| Stock chart |
|---|
 |
| Financial Analysis | |
|---|---|
| Price to Book Value: | Underperform |
| P/BV, a ratio used to compare book value to its current market price, to gauge whether a stock is valued properly. | |
| Price to Earnings: | Underperform |
| PE, the ratio for valuing a company that measures its current share price relative to its earnings per share (EPS). | |
| Discounted cash flow: | Underperform |
| DCF, a valuation method used to estimate the value of an investment based on its expected future cash flows. | |
| Return on Assets: | Underperform |
| ROA, indicates how profitable a company is in relation to its total assets, how efficiently uses assets to generate a profit. | |
| Return on Equity: | Outperform |
| ROE, a measure of financial performance calculated by dividing net income by equity. a gauge of profitability and efficiency. | |
| Debt to Equity: | Underperform |
| evaluate financial leverage, reflects the ability of equity to cover outstanding debts in the event of a business downturn. | |
| Stock Basics & Statistics | |
|---|---|
| Exchange: New York Stock Exchange | |
| Sector: Communication Services | |
| Industry: Entertainment | |
| Shares Out. (M) | 230.80 |
| Shares Float (M) | 158.34 |
| % Held by Insiders | 32.20 |
| % Held by Institutions | 75.59 |
| Shares Short (K) | 13770 |
| Shares Short Prior Month (K) | 12590 |
| Stock Financials | |
|---|---|
| EPS | 1.370 |
| Book Value (p.s.) | -0.070 |
| Profit Margin | 2.48 |
| Operating Margin | -0.80 |
| Return on Assets (ttm) | 3.8 |
| Return on Equity (ttm) | 65.4 |
| Qtrly Rev. Growth | 36.1 |
| Gross Profit (p.s.) | |
| Sales Per Share | 98.570 |
| EBITDA (p.s.) | 6.976 |
| Qtrly Earnings Growth | |
| Operating Cash Flow (M) | 1370.00 |
| Levered Free Cash Flow (M) | 1050.00 |
| Stock Valuation | |
|---|---|
| PE Ratio | 65.38 |
| PEG Ratio | 0.62 |
| Price to Book value | -1279.64 |
| Price to Sales | 0.91 |
| Price to Cash Flow | 15.09 |
| Stock Dividends | |
|---|---|
| Dividend | |
| Dividend Yield | |
| Dividend Growth | |