| McDonalds Corp (MCD) | |||
|---|---|---|---|
| 271.99 1.01 (0.37%) | 04-19 16:00 | ||
| Open: | 272.01 | Pre. Close: | 270.98 |
| High: | 272.218 | Low: | 270.505 |
| Volume: | 2,213,321 | Market Cap: | 196,106(M) |
| Stock Technical Analysis | |
|---|---|
| Overall: |  |
| Target: | Six months: 324.42 One year: 333.56 |
| Support: | Support1: 265.11 Support2: 220.57 |
| Resistance: | Resistance1: 277.76 Resistance2: 285.58 |
| Pivot: | 270.44 |
| Moving Averages: | MA(5): 268.92 MA(20): 273.02 MA(100): 287.28 MA(250): 283.64 |
| MACD: | MACD(12,26): -4.27 Signal(12,26,9): -4.85 |
| %K %D: | %K(14,3): 33.49 %D(3): 21.69 |
| RSI: | RSI(14): 43.40 |
| 52-Week: | High: 302.39 Low: 245.73 Change(%): -6.9 |
| Average Vol(K): | 3-Month: 3301 10-Days: 3104 |
| Prices Prediction (Update @5:00pm) | ||
|---|---|---|
| If tomorrow: | Open lower | Open higher |
| High: | 272.628 - 273.728 | 273.728 - 274.861 |
| Low: | 267.778 - 268.933 | 268.933 - 270.123 |
| Close: | 270.105 - 272.101 | 272.101 - 274.158 |
| Price, MAs and Bollinger Bands |
|---|
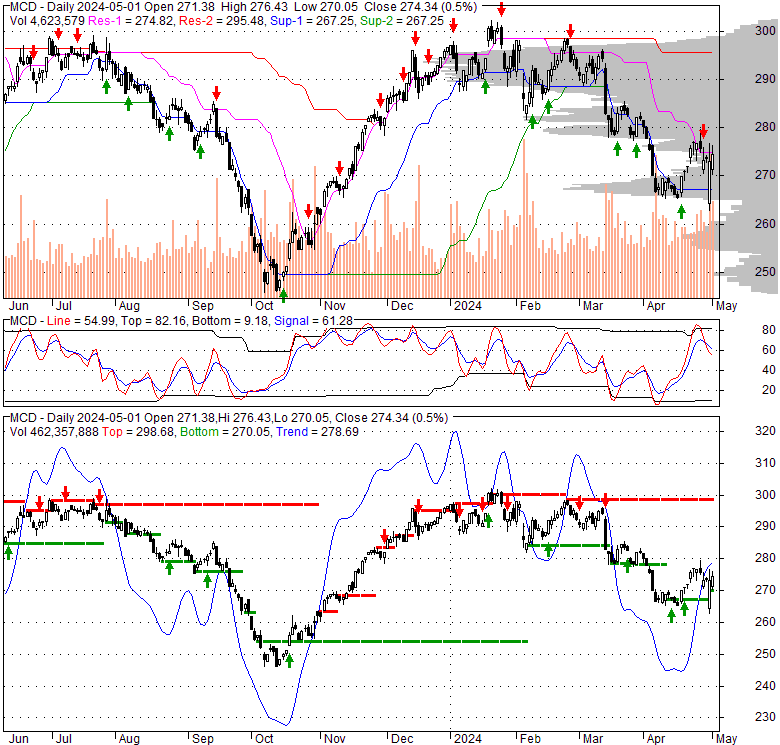
| Price has closed above its short-term moving average. Short-term moving average is currently below mid-term; and below long-term moving average. From the relationship between price and moving averages: This stock is NEUTRAL in short-term; and BEARISH in mid-long term.[ MCD ] has closed below upper band by 40.7%. Bollinger Bands are 4.9% wider than normal. The current width of the bands does not suggest anything about the future direction or movement of prices. |
| Company profile |
|---|
| McDonald's Corporation operates and franchises McDonald's restaurants in the United States and internationally. Its restaurants offer hamburgers and cheeseburgers, chicken sandwiches and nuggets, wraps, fries, salads, oatmeal, shakes, desserts, sundaes, soft serve cones, bakery items, soft drinks, coffee, and beverages and other beverages, as well as breakfast menu, including biscuit and bagel sandwiches, breakfast burritos, hotcakes, and other sandwiches. As of December 31, 2021, the company operated 40,031 restaurants. McDonald's Corporation was founded in 1940 and is headquartered in Chicago, Illinois. |
| Stock chart |
|---|
 |
| Financial Analysis | |
|---|---|
| Price to Book Value: | Underperform |
| P/BV, a ratio used to compare book value to its current market price, to gauge whether a stock is valued properly. | |
| Price to Earnings: | Outperform |
| PE, the ratio for valuing a company that measures its current share price relative to its earnings per share (EPS). | |
| Discounted cash flow: | Neutral |
| DCF, a valuation method used to estimate the value of an investment based on its expected future cash flows. | |
| Return on Assets: | Outperform |
| ROA, indicates how profitable a company is in relation to its total assets, how efficiently uses assets to generate a profit. | |
| Return on Equity: | Underperform |
| ROE, a measure of financial performance calculated by dividing net income by equity. a gauge of profitability and efficiency. | |
| Debt to Equity: | Underperform |
| evaluate financial leverage, reflects the ability of equity to cover outstanding debts in the event of a business downturn. | |
| Stock Basics & Statistics | |
|---|---|
| Exchange: New York Stock Exchange | |
| Sector: Consumer Cyclical | |
| Industry: Restaurants | |
| Shares Out. (M) | 721.00 |
| Shares Float (M) | 719.60 |
| % Held by Insiders | 0.17 |
| % Held by Institutions | 72.43 |
| Shares Short (K) | 8080 |
| Shares Short Prior Month (K) | 7590 |
| Stock Financials | |
|---|---|
| EPS | 11.550 |
| Book Value (p.s.) | -6.510 |
| Profit Margin | 33.22 |
| Operating Margin | 43.59 |
| Return on Assets (ttm) | 13.7 |
| Return on Equity (ttm) | |
| Qtrly Rev. Growth | 8.1 |
| Gross Profit (p.s.) | |
| Sales Per Share | 35.354 |
| EBITDA (p.s.) | 18.974 |
| Qtrly Earnings Growth | 8.30 |
| Operating Cash Flow (M) | 9610.00 |
| Levered Free Cash Flow (M) | 6530.00 |
| Stock Valuation | |
|---|---|
| PE Ratio | 23.55 |
| PEG Ratio | 2.92 |
| Price to Book value | -41.78 |
| Price to Sales | 7.69 |
| Price to Cash Flow | 20.41 |
| Stock Dividends | |
|---|---|
| Dividend | |
| Dividend Yield | |
| Dividend Growth | |