| Metlife Inc (MET) | |||
|---|---|---|---|
| 72.72 0.5 (0.69%) | 04-24 16:00 | ||
| Open: | 71.88 | Pre. Close: | 72.22 |
| High: | 72.76 | Low: | 71.66 |
| Volume: | 1,953,466 | Market Cap: | 52,578(M) |
| Stock Technical Analysis | |
|---|---|
| Overall: |  |
| Target: | Six months: 87.23 One year: 101.88 |
| Support: | Support1: 70.91 Support2: 68.58 |
| Resistance: | Resistance1: 74.68 Resistance2: 87.23 |
| Pivot: | 71.43 |
| Moving Averages: | MA(5): 71.54 MA(20): 72.00 MA(100): 69.13 MA(250): 63.33 |
| MACD: | MACD(12,26): -0.10 Signal(12,26,9): -0.12 |
| %K %D: | %K(14,3): 59.67 %D(3): 50.55 |
| RSI: | RSI(14): 56.41 |
| 52-Week: | High: 74.68 Low: 48.95 Change(%): 23.0 |
| Average Vol(K): | 3-Month: 3411 10-Days: 2799 |
| Prices Prediction (Update @5:00pm) | ||
|---|---|---|
| If tomorrow: | Open lower | Open higher |
| High: | 72.597 - 72.85 | 72.85 - 73.081 |
| Low: | 71.288 - 71.62 | 71.62 - 71.924 |
| Close: | 71.7 - 72.157 | 72.157 - 72.576 |
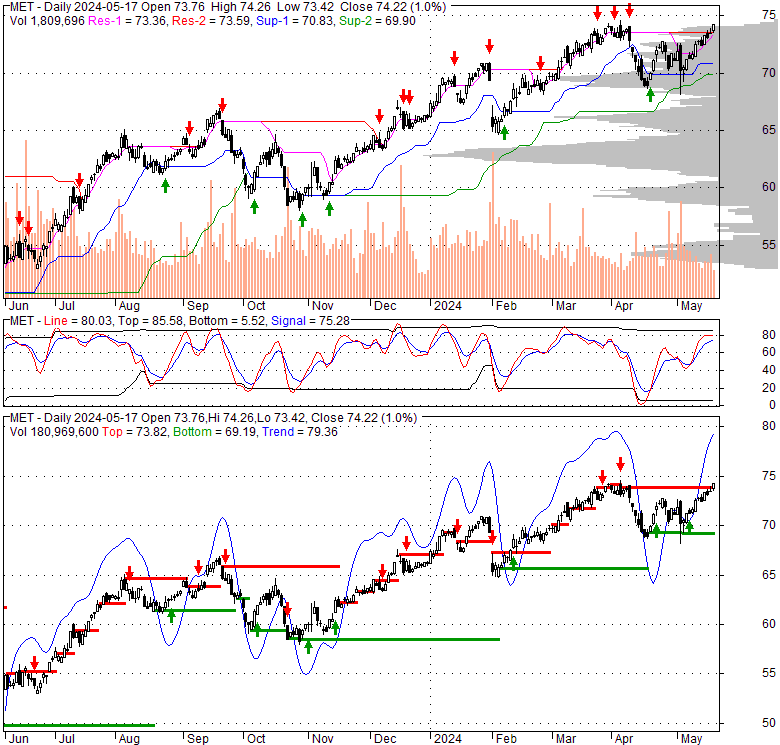
| Price, MAs and Bollinger Bands |
|---|
| Price has closed above its short-term moving average. Short-term moving average is currently above mid-term; and above long-term moving average. From the relationship between price and moving averages: This stock is BULLISH in short-term; and BULLISH in mid-long term.[ MET ] has closed below upper band by 33.5%. Bollinger Bands are 43.3% wider than normal. The large width of the bands suggest high volatility as compared to its normal range. The bands have been in this wide range for 6 days. This is a sign that the current trend might continue. |
| Company profile |
|---|
| MetLife, Inc., a financial services company, provides insurance, annuities, employee benefits, and asset management services worldwide. It operates through five segments: U.S.; Asia; Latin America; Europe, the Middle East and Africa; and MetLife Holdings. The company offers life, dental, group short-and long-term disability, individual disability, pet insurance, accidental death and dismemberment, vision, and accident and health coverages, as well as prepaid legal plans; administrative services-only arrangements to employers; and general and separate account, and synthetic guaranteed interest contracts, as well as private floating rate funding agreements. It also provides pension risk transfers, institutional income annuities, structured settlements, and capital markets investment products; and other products and services, such as life insurance products and funding agreements for funding postretirement benefits, as well as company, bank, or trust-owned life insurance used to finance nonqualified benefit programs for executives. In addition, it provides fixed, indexed-linked, and variable annuities; and pension products; regular savings products; whole and term life, endowments, universal and variable life, and group life products; longevity reinsurance solutions; credit insurance products; and protection against long-term health care services. MetLife, Inc. was founded in 1863 and is headquartered in New York, New York. |
| Stock chart |
|---|
 |
| Financial Analysis | |
|---|---|
| Price to Book Value: | Outperform |
| P/BV, a ratio used to compare book value to its current market price, to gauge whether a stock is valued properly. | |
| Price to Earnings: | Outperform |
| PE, the ratio for valuing a company that measures its current share price relative to its earnings per share (EPS). | |
| Discounted cash flow: | Outperform |
| DCF, a valuation method used to estimate the value of an investment based on its expected future cash flows. | |
| Return on Assets: | Underperform |
| ROA, indicates how profitable a company is in relation to its total assets, how efficiently uses assets to generate a profit. | |
| Return on Equity: | Neutral |
| ROE, a measure of financial performance calculated by dividing net income by equity. a gauge of profitability and efficiency. | |
| Debt to Equity: | Neutral |
| evaluate financial leverage, reflects the ability of equity to cover outstanding debts in the event of a business downturn. | |
| Stock Basics & Statistics | |
|---|---|
| Exchange: New York Stock Exchange | |
| Sector: Financial Services | |
| Industry: Insurance - Life | |
| Shares Out. (M) | 723.02 |
| Shares Float (M) | 603.71 |
| % Held by Insiders | 16.40 |
| % Held by Institutions | 75.95 |
| Shares Short (K) | 7360 |
| Shares Short Prior Month (K) | 5330 |
| Stock Financials | |
|---|---|
| EPS | 1.810 |
| Book Value (p.s.) | 41.070 |
| Profit Margin | 2.36 |
| Operating Margin | 13.83 |
| Return on Assets (ttm) | 0.3 |
| Return on Equity (ttm) | 5.3 |
| Qtrly Rev. Growth | 21.9 |
| Gross Profit (p.s.) | |
| Sales Per Share | 92.529 |
| EBITDA (p.s.) | 5.422 |
| Qtrly Earnings Growth | -60.70 |
| Operating Cash Flow (M) | 13720.00 |
| Levered Free Cash Flow (M) | -7450.00 |
| Stock Valuation | |
|---|---|
| PE Ratio | 40.04 |
| PEG Ratio | 0.70 |
| Price to Book value | 1.76 |
| Price to Sales | 0.78 |
| Price to Cash Flow | 3.82 |
| Stock Dividends | |
|---|---|
| Dividend | |
| Dividend Yield | |
| Dividend Growth | |


