| MGM Resorts International (MGM) | |||
|---|---|---|---|
| 42.04 0.01 (0.02%) | 04-18 16:00 | ||
| Open: | 41.89 | Pre. Close: | 42.03 |
| High: | 42.76 | Low: | 41.52 |
| Volume: | 2,967,115 | Market Cap: | 13,327(M) |
| Stock Technical Analysis | |
|---|---|
| Overall: |  |
| Target: | Six months: 53.35 One year: 56.36 |
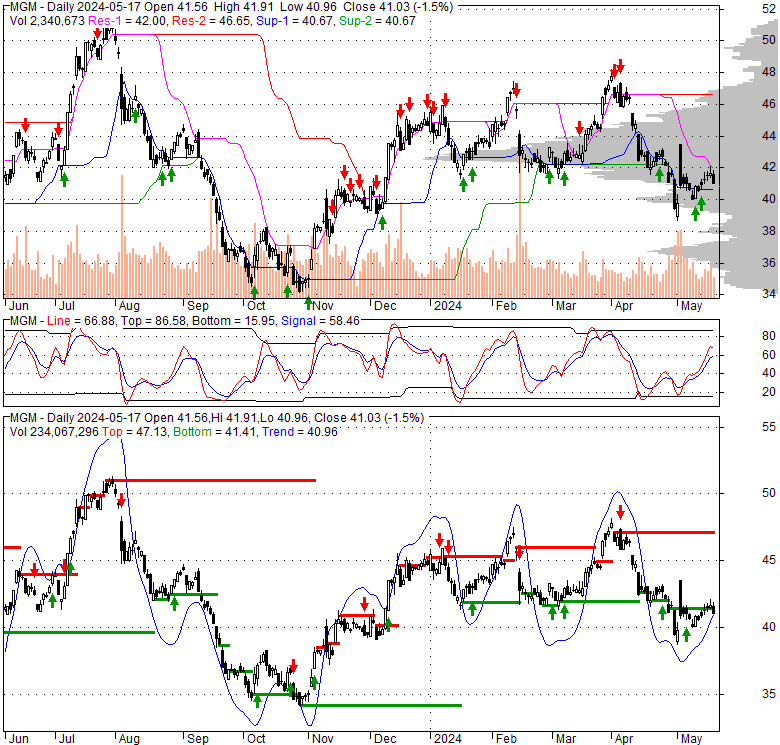
| Support: | Support1: 41.52 Support2: 34.54 |
| Resistance: | Resistance1: 45.68 Resistance2: 48.25 |
| Pivot: | 44.98 |
| Moving Averages: | MA(5): 42.42 MA(20): 45.08 MA(100): 43.53 MA(250): 42.52 |
| MACD: | MACD(12,26): -0.44 Signal(12,26,9): 0.12 |
| %K %D: | %K(14,3): 4.69 %D(3): 5.16 |
| RSI: | RSI(14): 35.38 |
| 52-Week: | High: 51.35 Low: 34.12 Change(%): -5.7 |
| Average Vol(K): | 3-Month: 3729 10-Days: 2878 |
| Prices Prediction (Update @5:00pm) | ||
|---|---|---|
| If tomorrow: | Open lower | Open higher |
| High: | 42.821 - 43.061 | 43.061 - 43.28 |
| Low: | 40.888 - 41.201 | 41.201 - 41.488 |
| Close: | 41.587 - 42.04 | 42.04 - 42.455 |
| Price, MAs and Bollinger Bands |
|---|
| Price has closed below its short-term moving average. Short-term moving average is currently below mid-term; and below long-term moving average. From the relationship between price and moving averages: This stock is BEARISH in short-term; and NEUTRAL in mid-long term.[ MGM ] has closed above bottom band by 12.7%. Bollinger Bands are 75.4% wider than normal. The large width of the bands suggest high volatility as compared to its normal range. The bands have been in this wide range for 2 days. This is a sign that the current trend might continue. |
| Company profile |
|---|
| MGM Resorts International, through its subsidiaries, owns and operates casino, hotel, and entertainment resorts in the United States and Macau. The company operates through three segments: Las Vegas Strip Resorts, Regional Operations, and MGM China. Its casino resorts offer gaming, hotel, convention, dining, entertainment, retail, and other resort amenities. The company's casino operations include slots and table games, as well as online sports betting and iGaming through BetMGM. As of February 17, 2021, its portfolio consisted of 29 hotel and destination gaming offerings. The company also owns and operates Las Vegas Strip Resorts and Fallen Oak golf course. Its customers include premium gaming customers; leisure and wholesale travel customers; business travelers; and group customers, including conventions, trade associations, and small meetings. The company was formerly known as MGM MIRAGE and changed its name to MGM Resorts International in June 2010. MGM Resorts International was incorporated in 1986 and is based in Las Vegas, Nevada. |
| Stock chart |
|---|
 |
| Financial Analysis | |
|---|---|
| Price to Book Value: | Outperform |
| P/BV, a ratio used to compare book value to its current market price, to gauge whether a stock is valued properly. | |
| Price to Earnings: | Neutral |
| PE, the ratio for valuing a company that measures its current share price relative to its earnings per share (EPS). | |
| Discounted cash flow: | Outperform |
| DCF, a valuation method used to estimate the value of an investment based on its expected future cash flows. | |
| Return on Assets: | Neutral |
| ROA, indicates how profitable a company is in relation to its total assets, how efficiently uses assets to generate a profit. | |
| Return on Equity: | Outperform |
| ROE, a measure of financial performance calculated by dividing net income by equity. a gauge of profitability and efficiency. | |
| Debt to Equity: | Outperform |
| evaluate financial leverage, reflects the ability of equity to cover outstanding debts in the event of a business downturn. | |
| Stock Basics & Statistics | |
|---|---|
| Exchange: New York Stock Exchange | |
| Sector: Consumer Cyclical | |
| Industry: Gambling, Resorts & Casinos | |
| Shares Out. (M) | 317.02 |
| Shares Float (M) | 251.50 |
| % Held by Insiders | 21.21 |
| % Held by Institutions | 69.15 |
| Shares Short (K) | 13400 |
| Shares Short Prior Month (K) | 13750 |
| Stock Financials | |
|---|---|
| EPS | 3.190 |
| Book Value (p.s.) | 11.670 |
| Profit Margin | 7.09 |
| Operating Margin | 9.64 |
| Return on Assets (ttm) | 2.3 |
| Return on Equity (ttm) | 27.0 |
| Qtrly Rev. Growth | 21.9 |
| Gross Profit (p.s.) | |
| Sales Per Share | 50.849 |
| EBITDA (p.s.) | 7.571 |
| Qtrly Earnings Growth | 34.20 |
| Operating Cash Flow (M) | 2690.00 |
| Levered Free Cash Flow (M) | 884.45 |
| Stock Valuation | |
|---|---|
| PE Ratio | 13.18 |
| PEG Ratio | 1.55 |
| Price to Book value | 3.60 |
| Price to Sales | 0.83 |
| Price to Cash Flow | 4.95 |
| Stock Dividends | |
|---|---|
| Dividend | |
| Dividend Yield | |
| Dividend Growth | |


