| Marathon Petroleum Corp (MPC) | |||
|---|---|---|---|
| 196.38 1.36 (0.7%) | 04-19 16:00 | ||
| Open: | 196.32 | Pre. Close: | 195.02 |
| High: | 198.58 | Low: | 195.03 |
| Volume: | 1,745,720 | Market Cap: | 70,763(M) |
| Stock Technical Analysis | |
|---|---|
| Overall: |  |
| Target: | Six months: 244.03 One year: 258.26 |
| Support: | Support1: 189.23 Support2: 157.44 |
| Resistance: | Resistance1: 208.93 Resistance2: 221.11 |
| Pivot: | 208.82 |
| Moving Averages: | MA(5): 200.95 MA(20): 206.40 MA(100): 171.34 MA(250): 148.40 |
| MACD: | MACD(12,26): 3.29 Signal(12,26,9): 6.40 |
| %K %D: | %K(14,3): 13.97 %D(3): 23.69 |
| RSI: | RSI(14): 44.34 |
| 52-Week: | High: 221.11 Low: 104.32 Change(%): 59.0 |
| Average Vol(K): | 3-Month: 2790 10-Days: 2214 |
| Prices Prediction (Update @5:00pm) | ||
|---|---|---|
| If tomorrow: | Open lower | Open higher |
| High: | 199.003 - 200.321 | 200.321 - 201.512 |
| Low: | 191.74 - 193.437 | 193.437 - 194.971 |
| Close: | 193.788 - 196.431 | 196.431 - 198.821 |
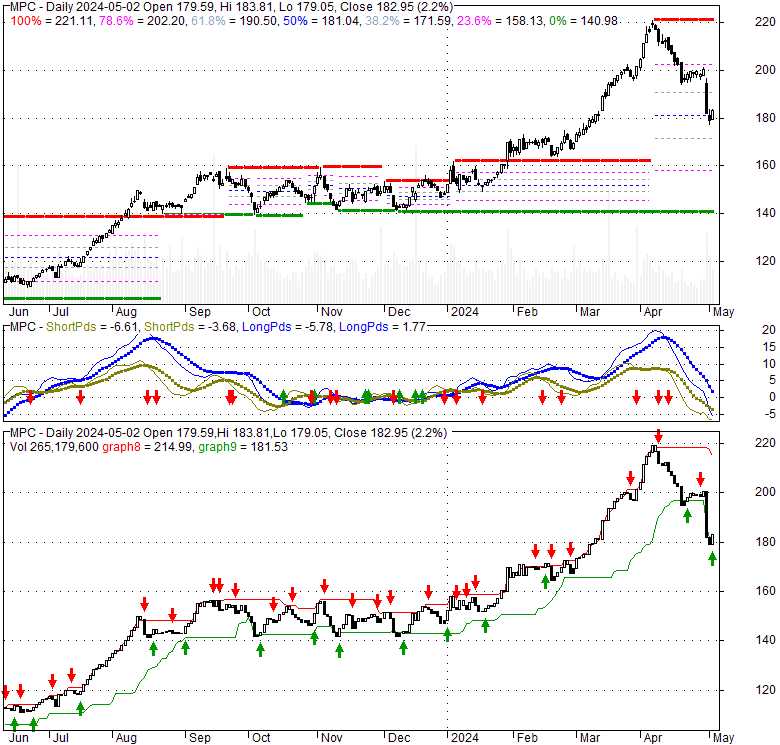
| Price, MAs and Bollinger Bands |
|---|
| Price has closed below its short-term moving average. Short-term moving average is currently above mid-term; and above long-term moving average. From the relationship between price and moving averages: This stock is NEUTRAL in short-term; and BULLISH in mid-long term.[ MPC ] has closed above bottom band by 5.6%. Bollinger Bands are 55.2% wider than normal. The large width of the bands suggest high volatility as compared to its normal range. The bands have been in this wide range for 28 days. This is a sign that the current trend might continue. |
| Company profile |
|---|
| Marathon Petroleum Corporation, together with its subsidiaries, operates as an integrated downstream energy company primarily in the United States. It operates in two segments, Refining & Marketing, and Midstream. The Refining & Marketing segment refines crude oil and other feedstocks at its refineries in the Gulf Coast, Mid-Continent, and West Coast regions of the United States; and purchases refined products and ethanol for resale. Its refined products include transportation fuels, such as reformulated gasolines and blend-grade gasolines; heavy fuel oil; and asphalt. This segment also manufactures aromatics, propane, propylene, and sulfur. It sells refined products to wholesale marketing customers in the United States and internationally, buyers on the spot market, and independent entrepreneurs who operate primarily Marathon branded outlets, as well as through long-term fuel supply contracts to direct dealer locations primarily under the ARCO brand. The Midstream segment transports, stores, distributes, and markets crude oil and refined products through refining logistics assets, pipelines, terminals, towboats, and barges; gathers, processes, and transports natural gas; and gathers, transports, fractionates, stores, and markets natural gas liquids. As of December 31, 2021, the company operated 7,159 brand jobber outlets in 37 states, the District of Columbia, and Mexico through independent entrepreneurs. Marathon Petroleum Corporation was founded in 1887 and is headquartered in Findlay, Ohio. |
| Stock chart |
|---|
 |
| Financial Analysis | |
|---|---|
| Price to Book Value: | Outperform |
| P/BV, a ratio used to compare book value to its current market price, to gauge whether a stock is valued properly. | |
| Price to Earnings: | Outperform |
| PE, the ratio for valuing a company that measures its current share price relative to its earnings per share (EPS). | |
| Discounted cash flow: | Outperform |
| DCF, a valuation method used to estimate the value of an investment based on its expected future cash flows. | |
| Return on Assets: | Outperform |
| ROA, indicates how profitable a company is in relation to its total assets, how efficiently uses assets to generate a profit. | |
| Return on Equity: | Outperform |
| ROE, a measure of financial performance calculated by dividing net income by equity. a gauge of profitability and efficiency. | |
| Debt to Equity: | Outperform |
| evaluate financial leverage, reflects the ability of equity to cover outstanding debts in the event of a business downturn. | |
| Stock Basics & Statistics | |
|---|---|
| Exchange: New York Stock Exchange | |
| Sector: Energy | |
| Industry: Oil & Gas Refining & Marketing | |
| Shares Out. (M) | 360.34 |
| Shares Float (M) | 360.22 |
| % Held by Insiders | 0.29 |
| % Held by Institutions | 78.39 |
| Shares Short (K) | 7680 |
| Shares Short Prior Month (K) | 7770 |
| Stock Financials | |
|---|---|
| EPS | 23.630 |
| Book Value (p.s.) | 66.320 |
| Profit Margin | 6.48 |
| Operating Margin | 5.83 |
| Return on Assets (ttm) | 9.7 |
| Return on Equity (ttm) | 33.6 |
| Qtrly Rev. Growth | -8.5 |
| Gross Profit (p.s.) | |
| Sales Per Share | 414.470 |
| EBITDA (p.s.) | 47.039 |
| Qtrly Earnings Growth | -45.90 |
| Operating Cash Flow (M) | 14120.00 |
| Levered Free Cash Flow (M) | 10090.00 |
| Stock Valuation | |
|---|---|
| PE Ratio | 8.31 |
| PEG Ratio | -1.78 |
| Price to Book value | 2.96 |
| Price to Sales | 0.47 |
| Price to Cash Flow | 5.01 |
| Stock Dividends | |
|---|---|
| Dividend | |
| Dividend Yield | |
| Dividend Growth | |


