| Marathon Oil Corp (MRO) | |||
|---|---|---|---|
| 27.4 -0.28 (-1.01%) | 04-18 16:00 | ||
| Open: | 27.77 | Pre. Close: | 27.68 |
| High: | 27.86 | Low: | 27.33 |
| Volume: | 9,124,369 | Market Cap: | 15,815(M) |
| Stock Technical Analysis | |
|---|---|
| Overall: |  |
| Target: | Six months: 33.29 One year: 35.11 |
| Support: | Support1: 25.98 Support2: 21.62 |
| Resistance: | Resistance1: 28.50 Resistance2: 30.06 |
| Pivot: | 28.90 |
| Moving Averages: | MA(5): 28.26 MA(20): 28.53 MA(100): 24.92 MA(250): 25.03 |
| MACD: | MACD(12,26): 0.62 Signal(12,26,9): 0.96 |
| %K %D: | %K(14,3): 18.48 %D(3): 36.19 |
| RSI: | RSI(14): 45.45 |
| 52-Week: | High: 30.06 Low: 21.63 Change(%): 12.9 |
| Average Vol(K): | 3-Month: 9999 10-Days: 9616 |
| Prices Prediction (Update @5:00pm) | ||
|---|---|---|
| If tomorrow: | Open lower | Open higher |
| High: | 28.042 - 28.311 | 28.311 - 28.474 |
| Low: | 26.753 - 27.108 | 27.108 - 27.323 |
| Close: | 26.996 - 27.569 | 27.569 - 27.916 |
| Price, MAs and Bollinger Bands |
|---|
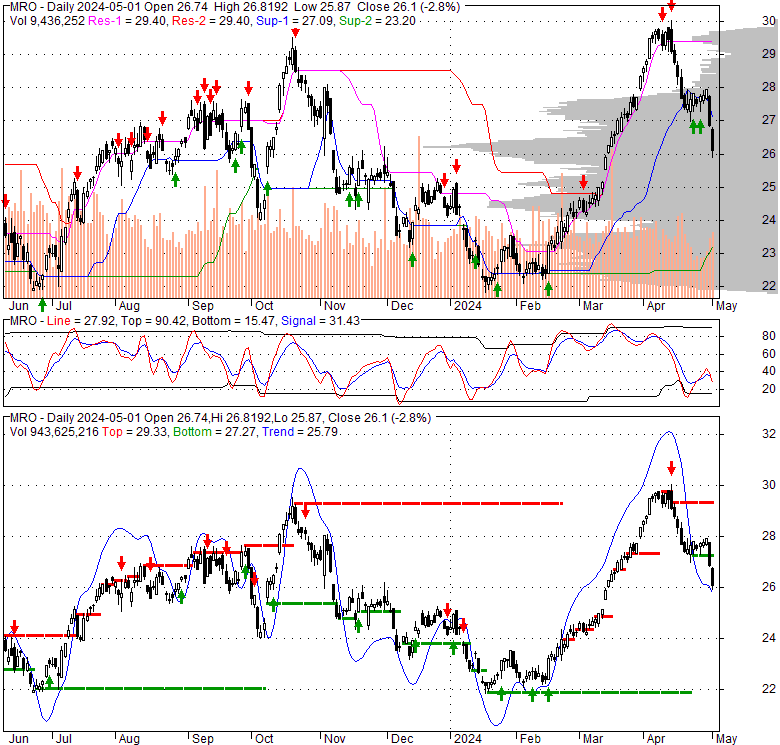
| Price has closed below its short-term moving average. Short-term moving average is currently above mid-term; and above long-term moving average. From the relationship between price and moving averages: This stock is NEUTRAL in short-term; and BULLISH in mid-long term.[ MRO ] has closed below the lower bollinger band by 4.1%. Bollinger Bands are 10% wider than normal. The current width of the bands does not suggest anything about the future direction or movement of prices. |
| Company profile |
|---|
| Marathon Oil Corporation operates as an independent exploration and production company in the United States and internationally. The company engages in the exploration, production, and marketing of crude oil and condensate, natural gas liquids, and natural gas; and the production and marketing of products manufactured from natural gas, such as liquefied natural gas and methanol. It also owns and operates 32 central gathering and treating facilities; and the Sugarloaf gathering system, a 42-mile natural gas pipeline through Karnes and Atascosa Counties. The company was formerly known as USX Corporation and changed its name to Marathon Oil Corporation in December 2001. Marathon Oil Corporation was founded in 1887 and is headquartered in Houston, Texas. |
| Stock chart |
|---|
 |
| Financial Analysis | |
|---|---|
| Price to Book Value: | Neutral |
| P/BV, a ratio used to compare book value to its current market price, to gauge whether a stock is valued properly. | |
| Price to Earnings: | Outperform |
| PE, the ratio for valuing a company that measures its current share price relative to its earnings per share (EPS). | |
| Discounted cash flow: | Outperform |
| DCF, a valuation method used to estimate the value of an investment based on its expected future cash flows. | |
| Return on Assets: | Outperform |
| ROA, indicates how profitable a company is in relation to its total assets, how efficiently uses assets to generate a profit. | |
| Return on Equity: | Outperform |
| ROE, a measure of financial performance calculated by dividing net income by equity. a gauge of profitability and efficiency. | |
| Debt to Equity: | Outperform |
| evaluate financial leverage, reflects the ability of equity to cover outstanding debts in the event of a business downturn. | |
| Stock Basics & Statistics | |
|---|---|
| Exchange: New York Stock Exchange | |
| Sector: Energy | |
| Industry: Oil & Gas Exploration & Production | |
| Shares Out. (M) | 571.48 |
| Shares Float (M) | 575.11 |
| % Held by Insiders | 0.38 |
| % Held by Institutions | 79.74 |
| Shares Short (K) | 14890 |
| Shares Short Prior Month (K) | 12160 |
| Stock Financials | |
|---|---|
| EPS | 2.560 |
| Book Value (p.s.) | 19.420 |
| Profit Margin | 24.08 |
| Operating Margin | 29.16 |
| Return on Assets (ttm) | 6.5 |
| Return on Equity (ttm) | 13.8 |
| Qtrly Rev. Growth | -0.1 |
| Gross Profit (p.s.) | |
| Sales Per Share | 11.286 |
| EBITDA (p.s.) | 7.542 |
| Qtrly Earnings Growth | -17.50 |
| Operating Cash Flow (M) | 4090.00 |
| Levered Free Cash Flow (M) | 1220.00 |
| Stock Valuation | |
|---|---|
| PE Ratio | 10.70 |
| PEG Ratio | -1.25 |
| Price to Book value | 1.41 |
| Price to Sales | 2.43 |
| Price to Cash Flow | 3.83 |
| Stock Dividends | |
|---|---|
| Dividend | |
| Dividend Yield | |
| Dividend Growth | |