| Marvell Technology Inc (MRVL) | |||
|---|---|---|---|
| 65.24 -1.24 (-1.87%) | 04-18 16:00 | ||
| Open: | 65.5 | Pre. Close: | 66.48 |
| High: | 66.37 | Low: | 64.38 |
| Volume: | 11,852,439 | Market Cap: | 56,498(M) |
| Stock Technical Analysis | |
|---|---|
| Overall: |  |
| Target: | Six months: 83.38 One year: 89.11 |
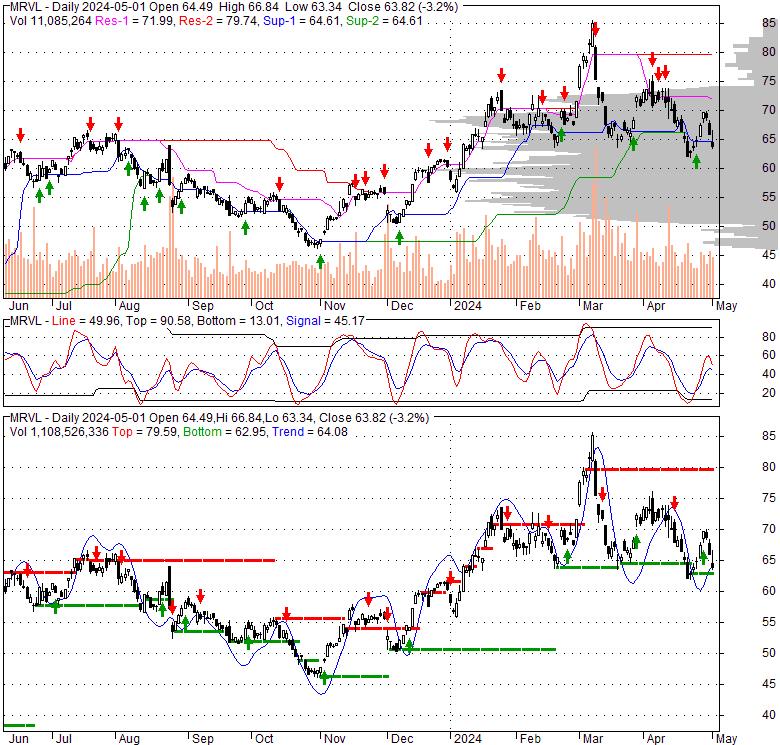
| Support: | Support1: 63.46 Support2: 52.80 |
| Resistance: | Resistance1: 71.39 Resistance2: 76.29 |
| Pivot: | 70.70 |
| Moving Averages: | MA(5): 67.61 MA(20): 70.02 MA(100): 65.84 MA(250): 59.10 |
| MACD: | MACD(12,26): -0.70 Signal(12,26,9): -0.01 |
| %K %D: | %K(14,3): 7.92 %D(3): 17.99 |
| RSI: | RSI(14): 38.57 |
| 52-Week: | High: 85.76 Low: 36.9 Change(%): 65.3 |
| Average Vol(K): | 3-Month: 14317 10-Days: 12346 |
| Prices Prediction (Update @5:00pm) | ||
|---|---|---|
| If tomorrow: | Open lower | Open higher |
| High: | 66.498 - 66.876 | 66.876 - 67.286 |
| Low: | 63.329 - 63.744 | 63.744 - 64.195 |
| Close: | 64.451 - 65.178 | 65.178 - 65.969 |
| Price, MAs and Bollinger Bands |
|---|
| Price has closed below its short-term moving average. Short-term moving average is currently below mid-term; and above long-term moving average. From the relationship between price and moving averages: This stock is BEARISH in short-term; and NEUTRAL in mid-long term.[ MRVL ] has closed below the lower bollinger band by 4.1%. If price is in a downtrend band; this downward trend might continue. However a short term pullback inside the band is likely. Bollinger Bands are 15.6% narrower than normal. The current width of the bands does not suggest anything about the future direction or movement of prices. |
| Company profile |
|---|
| Marvell Technology, Inc., together with its subsidiaries, designs, develops, and sells analog, mixed-signal, digital signal processing, and embedded and standalone integrated circuits. It offers a portfolio of Ethernet solutions, including controllers, network adapters, physical transceivers, and switches; single or multiple core processors; ASIC; and printer System-on-a-Chip products and application processors. The company also provides a range of storage products comprising storage controllers for hard disk drives (HDD) and solid-state drives that support various host system interfaces consisting of serial attached SCSI (SAS), serial advanced technology attachment (SATA), peripheral component interconnect express, non-volatile memory express (NVMe), and NVMe over fabrics; and fiber channel products, including host bus adapters, and controllers for server and storage system connectivity. It has operations in the United States, China, Malaysia, the Philippines, Thailand, Singapore, India, Israel, Japan, South Korea, Taiwan, and Vietnam. Marvell Technology, Inc. was incorporated in 1995 and is headquartered in Wilmington, Delaware. |
| Stock chart |
|---|
 |
| Financial Analysis | |
|---|---|
| Price to Book Value: | Outperform |
| P/BV, a ratio used to compare book value to its current market price, to gauge whether a stock is valued properly. | |
| Price to Earnings: | Underperform |
| PE, the ratio for valuing a company that measures its current share price relative to its earnings per share (EPS). | |
| Discounted cash flow: | Neutral |
| DCF, a valuation method used to estimate the value of an investment based on its expected future cash flows. | |
| Return on Assets: | Underperform |
| ROA, indicates how profitable a company is in relation to its total assets, how efficiently uses assets to generate a profit. | |
| Return on Equity: | Underperform |
| ROE, a measure of financial performance calculated by dividing net income by equity. a gauge of profitability and efficiency. | |
| Debt to Equity: | Outperform |
| evaluate financial leverage, reflects the ability of equity to cover outstanding debts in the event of a business downturn. | |
| Stock Basics & Statistics | |
|---|---|
| Exchange: NASDAQ Global Select | |
| Sector: Technology | |
| Industry: Semiconductors | |
| Shares Out. (M) | 866.00 |
| Shares Float (M) | 860.38 |
| % Held by Insiders | 0.50 |
| % Held by Institutions | 88.58 |
| Shares Short (K) | 17810 |
| Shares Short Prior Month (K) | 20960 |
| Stock Financials | |
|---|---|
| EPS | -1.080 |
| Book Value (p.s.) | 17.140 |
| Profit Margin | -16.95 |
| Operating Margin | -0.53 |
| Return on Assets (ttm) | -1.3 |
| Return on Equity (ttm) | -6.1 |
| Qtrly Rev. Growth | 0.6 |
| Gross Profit (p.s.) | |
| Sales Per Share | 6.363 |
| EBITDA (p.s.) | 1.110 |
| Qtrly Earnings Growth | |
| Operating Cash Flow (M) | 1370.00 |
| Levered Free Cash Flow (M) | 1470.00 |
| Stock Valuation | |
|---|---|
| PE Ratio | -60.41 |
| PEG Ratio | 2.79 |
| Price to Book value | 3.81 |
| Price to Sales | 10.25 |
| Price to Cash Flow | 41.24 |
| Stock Dividends | |
|---|---|
| Dividend | |
| Dividend Yield | |
| Dividend Growth | |


