| Nikola Corp (NKLA) | |||
|---|---|---|---|
| 0.62 -0.015 (-2.41%) | 04-24 16:00 | ||
| Open: | 0.6535 | Pre. Close: | 0.6353 |
| High: | 0.6579 | Low: | 0.62 |
| Volume: | 80,254,414 | Market Cap: | 828(M) |
| Stock Technical Analysis | |
|---|---|
| Overall: |  |
| Target: | Six months: 1.10 One year: 1.34 |
| Support: | Support1: 0.61 Support2: 0.51 |
| Resistance: | Resistance1: 0.94 Resistance2: 1.15 |
| Pivot: | 0.77 |
| Moving Averages: | MA(5): 0.64 MA(20): 0.82 MA(100): 0.76 MA(250): 1.09 |
| MACD: | MACD(12,26): -0.04 Signal(12,26,9): -0.01 |
| %K %D: | %K(14,3): 3.69 %D(3): 3.38 |
| RSI: | RSI(14): 37.24 |
| 52-Week: | High: 3.71 Low: 0.521 Change(%): -23.0 |
| Average Vol(K): | 3-Month: 94985 10-Days: 98391 |
| Prices Prediction (Update @5:00pm) | ||
|---|---|---|
| If tomorrow: | Open lower | Open higher |
| High: | 0.661 - 0.664 | 0.664 - 0.667 |
| Low: | 0.611 - 0.615 | 0.615 - 0.619 |
| Close: | 0.613 - 0.619 | 0.619 - 0.625 |
| Price, MAs and Bollinger Bands |
|---|
| Price has closed below its short-term moving average. Short-term moving average is currently below mid-term; and below long-term moving average. From the relationship between price and moving averages: This stock is BEARISH in short-term; and BEARISH in mid-long term.[ NKLA ] has closed above bottom band by 26.8%. Bollinger Bands are 116.9% wider than normal. The large width of the bands suggest high volatility as compared to its normal range. The bands have been in this wide range for 19 days. This is a sign that the current trend might continue. |
| Company profile |
|---|
| Nikola Corporation operates as a technology innovator and integrator that works to develop energy and transportation solutions. It operates through two business units, Truck and Energy. The Truck business unit develops and commercializes battery hydrogen-electric and battery-electric semi-trucks to the trucking sector. The Energy business unit develops and constructs a network of hydrogen fueling stations; and offers BEV charging solutions for its FCEV and BEV customers, as well as other third-party customers. The company also assembles, integrates, and commissions its vehicles in collaboration with its business partners and suppliers. Nikola Corporation is headquartered in Phoenix, Arizona. |
| Stock chart |
|---|
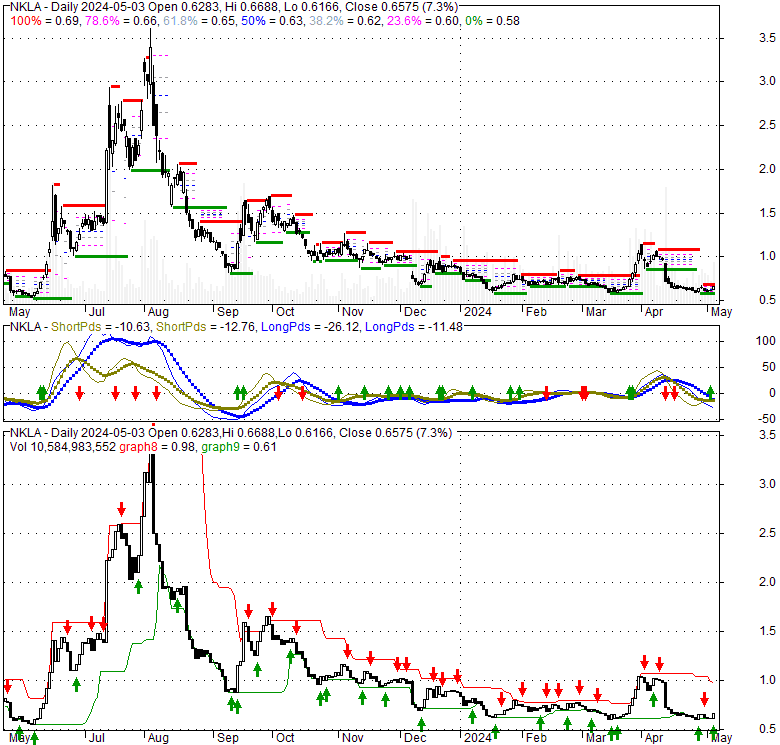 |
| Financial Analysis | |
|---|---|
| Price to Book Value: | Neutral |
| P/BV, a ratio used to compare book value to its current market price, to gauge whether a stock is valued properly. | |
| Price to Earnings: | Underperform |
| PE, the ratio for valuing a company that measures its current share price relative to its earnings per share (EPS). | |
| Discounted cash flow: | Underperform |
| DCF, a valuation method used to estimate the value of an investment based on its expected future cash flows. | |
| Return on Assets: | Underperform |
| ROA, indicates how profitable a company is in relation to its total assets, how efficiently uses assets to generate a profit. | |
| Return on Equity: | Underperform |
| ROE, a measure of financial performance calculated by dividing net income by equity. a gauge of profitability and efficiency. | |
| Debt to Equity: | Neutral |
| evaluate financial leverage, reflects the ability of equity to cover outstanding debts in the event of a business downturn. | |
| Stock Basics & Statistics | |
|---|---|
| Exchange: NASDAQ Global Select | |
| Sector: Industrials | |
| Industry: Agricultural - Machinery | |
| Shares Out. (M) | |
| Shares Float (M) | 1340.00 |
| % Held by Insiders | 1240000000.00 |
| % Held by Institutions | 7.45 |
| Shares Short (K) | 216730 |
| Shares Short Prior Month (K) | |
| Stock Financials | |
|---|---|
| EPS | -585110016.000 |
| Book Value (p.s.) | |
| Profit Margin | |
| Operating Margin | |
| Return on Assets (ttm) | 18.3 |
| Return on Equity (ttm) | -30.9 |
| Qtrly Rev. Growth | 35840000.0 |
| Gross Profit (p.s.) | 37.850 |
| Sales Per Share | -69.410 |
| EBITDA (p.s.) | |
| Qtrly Earnings Growth | -1.21 |
| Operating Cash Flow (M) | |
| Levered Free Cash Flow (M) | -496.18 |
| Stock Valuation | |
|---|---|
| PE Ratio | |
| PEG Ratio | 0.04 |
| Price to Book value | |
| Price to Sales | -0.01 |
| Price to Cash Flow | 2.30 |
| Stock Dividends | |
|---|---|
| Dividend | |
| Dividend Yield | |
| Dividend Growth | 239050000.000 |


