| Envista Holdings Corp (NVST) | |||
|---|---|---|---|
| 19.96 0.21 (1.06%) | 04-19 16:00 | ||
| Open: | 19.71 | Pre. Close: | 19.75 |
| High: | 20 | Low: | 19.71 |
| Volume: | 1,126,711 | Market Cap: | 3,430(M) |
| Stock Technical Analysis | |
|---|---|
| Overall: |  |
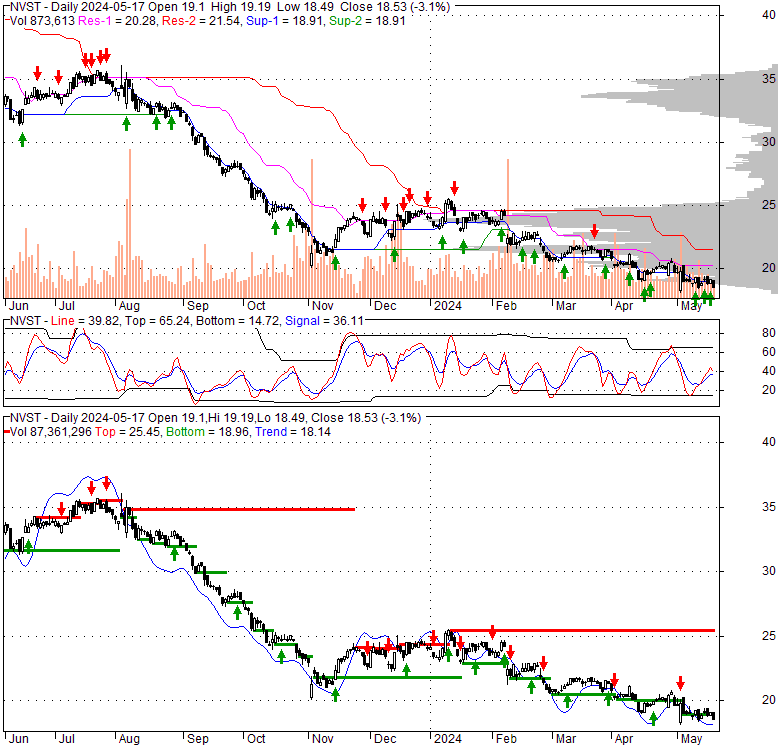
| Target: | Six months: 24.27 One year: 25.58 |
| Support: | Support1: 18.95 Support2: 15.77 |
| Resistance: | Resistance1: 20.78 Resistance2: 21.90 |
| Pivot: | 20.09 |
| Moving Averages: | MA(5): 19.64 MA(20): 20.37 MA(100): 22.54 MA(250): 27.51 |
| MACD: | MACD(12,26): -0.49 Signal(12,26,9): -0.48 |
| %K %D: | %K(14,3): 31.70 %D(3): 26.83 |
| RSI: | RSI(14): 43.61 |
| 52-Week: | High: 39.28 Low: 18.955 Change(%): -48.7 |
| Average Vol(K): | 3-Month: 2457 10-Days: 1858 |
| Prices Prediction (Update @5:00pm) | ||
|---|---|---|
| If tomorrow: | Open lower | Open higher |
| High: | 20.026 - 20.107 | 20.107 - 20.184 |
| Low: | 19.507 - 19.598 | 19.598 - 19.684 |
| Close: | 19.816 - 19.957 | 19.957 - 20.092 |
| Price, MAs and Bollinger Bands |
|---|
| Price has closed above its short-term moving average. Short-term moving average is currently below mid-term; and below long-term moving average. From the relationship between price and moving averages: This stock is NEUTRAL in short-term; and BEARISH in mid-long term.[ NVST ] has closed above bottom band by 43.9%. Bollinger Bands are 12.4% narrower than normal. The current width of the bands does not suggest anything about the future direction or movement of prices. |
| Company profile |
|---|
| Envista Holdings Corporation, together with its subsidiaries, engages in the development, sale, and marketing of dental products in the United States, China, and internationally. The company operates in two segments, Specialty Products & Technologies and Equipment & Consumables. The company's Specialty Products & Technologies segment provides dental implant systems, guided surgery systems, biomaterials, and prefabricated and custom-built prosthetics to oral surgeons, prosthodontists, and periodontists under the Nobel Biocare, Alpha-Bio Tec, Implant Direct, Nobel Procera, and Orascoptic brands; and brackets and wires, tubes and bands, archwires, clear aligners, digital orthodontic treatments, retainers, and other orthodontic laboratory products under the Damon, Insignia, AOA, and Spark brands. This segment also offers software packages, which include DTX Studio Implant for treatment planning of dental implants; TX Studio Lab for prosthetics treatment planning; and DTX Studio Clinic to store and access a various clinical patient images. The company's Equipment & Consumables segment provides dental equipment and supplies, including digital imaging systems, sensors, software, and other visualization/magnification systems; endodontic systems and related consumables; restorative materials, rotary burs, impression materials, bonding agents, and cements; and infection prevention products. This segment offers its products under the Dexis, Gendex, i-CAT, Kerr, Metrex, Total Care, Pentron, Optibond, Harmonize, Sonicfill, Sybron Endo, and CaviWipes to dental offices, clinics, and hospitals. Envista Holdings Corporation was incorporated in 2018 and is headquartered in Brea, California. |
| Stock chart |
|---|
 |
| Financial Analysis | |
|---|---|
| Price to Book Value: | Neutral |
| P/BV, a ratio used to compare book value to its current market price, to gauge whether a stock is valued properly. | |
| Price to Earnings: | Underperform |
| PE, the ratio for valuing a company that measures its current share price relative to its earnings per share (EPS). | |
| Discounted cash flow: | Outperform |
| DCF, a valuation method used to estimate the value of an investment based on its expected future cash flows. | |
| Return on Assets: | Neutral |
| ROA, indicates how profitable a company is in relation to its total assets, how efficiently uses assets to generate a profit. | |
| Return on Equity: | Underperform |
| ROE, a measure of financial performance calculated by dividing net income by equity. a gauge of profitability and efficiency. | |
| Debt to Equity: | Outperform |
| evaluate financial leverage, reflects the ability of equity to cover outstanding debts in the event of a business downturn. | |
| Stock Basics & Statistics | |
|---|---|
| Exchange: New York Stock Exchange | |
| Sector: Healthcare | |
| Industry: Medical - Instruments & Supplies | |
| Shares Out. (M) | 171.86 |
| Shares Float (M) | 170.96 |
| % Held by Insiders | 0.41 |
| % Held by Institutions | 109.55 |
| Shares Short (K) | 10840 |
| Shares Short Prior Month (K) | 8600 |
| Stock Financials | |
|---|---|
| EPS | -0.600 |
| Book Value (p.s.) | 24.340 |
| Profit Margin | -3.90 |
| Operating Margin | 10.60 |
| Return on Assets (ttm) | 3.1 |
| Return on Equity (ttm) | -2.4 |
| Qtrly Rev. Growth | -2.3 |
| Gross Profit (p.s.) | |
| Sales Per Share | 14.954 |
| EBITDA (p.s.) | 2.694 |
| Qtrly Earnings Growth | |
| Operating Cash Flow (M) | 275.70 |
| Levered Free Cash Flow (M) | 254.20 |
| Stock Valuation | |
|---|---|
| PE Ratio | -33.27 |
| PEG Ratio | 2.18 |
| Price to Book value | 0.82 |
| Price to Sales | 1.33 |
| Price to Cash Flow | 12.44 |
| Stock Dividends | |
|---|---|
| Dividend | |
| Dividend Yield | |
| Dividend Growth | |


