| Onconova Therapeutic (ONTX) | |||
|---|---|---|---|
| 0.9953 -0.005 (-0.47%) | 04-02 16:00 | ||
| Open: | 0.9999 | Pre. Close: | 1 |
| High: | 1 | Low: | 0.7655 |
| Volume: | 1,254,618 | Market Cap: | 21(M) |
| Stock Technical Analysis | |
|---|---|
| Overall: |  |
| Target: | Six months: 1.08 One year: 1.28 |
| Support: | Support1: 0.65 Support2: 0.54 |
| Resistance: | Resistance1: 0.93 Resistance2: 1.10 |
| Pivot: | 0.79 |
| Moving Averages: | MA(5): 0.69 MA(20): 0.82 MA(100): 0.76 MA(250): 0.86 |
| MACD: | MACD(12,26): -0.05 Signal(12,26,9): -0.02 |
| %K %D: | %K(14,3): 7.48 %D(3): 6.07 |
| RSI: | RSI(14): 32.55 |
| 52-Week: | High: 1.45 Low: 0.5509 Change(%): -38.5 |
| Average Vol(K): | 3-Month: 130 10-Days: 85 |
| Prices Prediction (Update @5:00pm) | ||
|---|---|---|
| If tomorrow: | Open lower | Open higher |
| High: | 0.721 - 0.724 | 0.724 - 0.728 |
| Low: | 0.64 - 0.645 | 0.645 - 0.649 |
| Close: | 0.662 - 0.669 | 0.669 - 0.675 |
| Price, MAs and Bollinger Bands |
|---|
| Price has closed below its short-term moving average. Short-term moving average is currently below mid-term; and below long-term moving average. From the relationship between price and moving averages: This stock is BEARISH in short-term; and NEUTRAL in mid-long term.[ ONTX ] has closed above bottom band by 20.5%. Bollinger Bands are 128.7% wider than normal. The large width of the bands suggest high volatility as compared to its normal range. The bands have been in this wide range for 16 days. This is a sign that the current trend might continue. |
| Company profile |
|---|
| Onconova Therapeutics, Inc., a clinical-stage biopharmaceutical company, focuses on discovering and developing novel products to treat cancer. It has two clinical-stage programs, including narazaciclib (ON 123300), a multi-targeted kinase inhibitor that is in Phase I study for solid tumors, as well as hematological malignancies as a single agent or in combination with other anti-cancer therapies; and oral rigosertib alone or in combination with PD-1 inhibitor, which is in Phase I/IIa for the treatment of progressive K-Ras mutated non-small cell lung cancer. The company develops a Phase Ib/II ISS with rigosertib monotherapy in patients with advanced squamous cell carcinoma associated with recessive dystrophic epidermolysis bullosa; and has a preclinical program comprising IV/oral rigosertib for COVID-19. It has a license agreement with SymBio Pharmaceuticals Limited; license, development, and commercialization agreement with Pint International SA.; and a license and collaboration agreement with HanX Biopharmaceuticals, Inc. for the development, registration, and commercialization of narazaciclib. Onconova Therapeutics, Inc. was incorporated in 1998 and is headquartered in Newtown, Pennsylvania. |
| Stock chart |
|---|
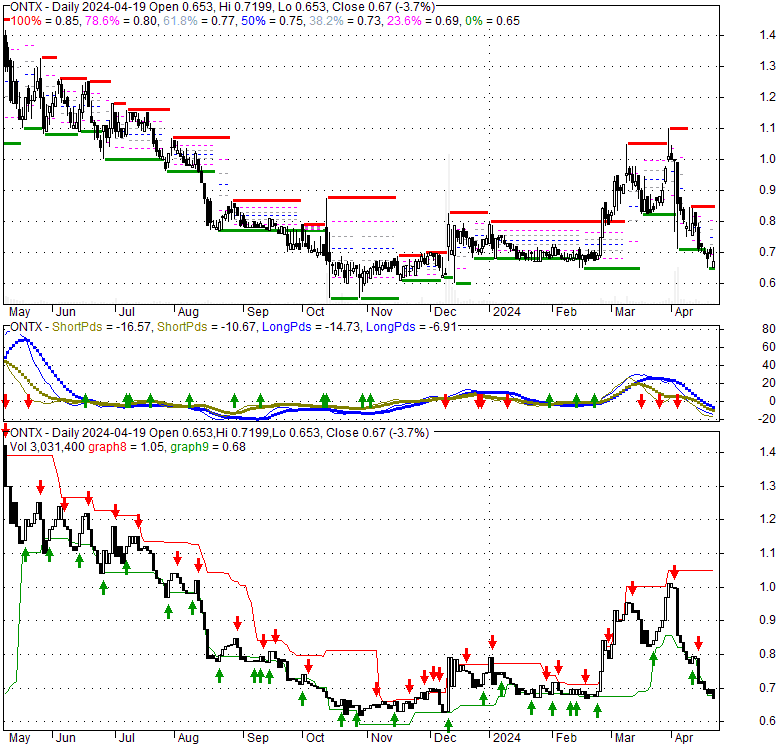 |
| Financial Analysis | |
|---|---|
| Price to Book Value: | Neutral |
| P/BV, a ratio used to compare book value to its current market price, to gauge whether a stock is valued properly. | |
| Price to Earnings: | Neutral |
| PE, the ratio for valuing a company that measures its current share price relative to its earnings per share (EPS). | |
| Discounted cash flow: | Outperform |
| DCF, a valuation method used to estimate the value of an investment based on its expected future cash flows. | |
| Return on Assets: | Underperform |
| ROA, indicates how profitable a company is in relation to its total assets, how efficiently uses assets to generate a profit. | |
| Return on Equity: | Underperform |
| ROE, a measure of financial performance calculated by dividing net income by equity. a gauge of profitability and efficiency. | |
| Debt to Equity: | Neutral |
| evaluate financial leverage, reflects the ability of equity to cover outstanding debts in the event of a business downturn. | |
| Stock Basics & Statistics | |
|---|---|
| Exchange: NASDAQ Capital Market | |
| Sector: Healthcare | |
| Industry: Biotechnology | |
| Shares Out. (M) | |
| Shares Float (M) | 21.00 |
| % Held by Insiders | 20840000.00 |
| % Held by Institutions | 0.78 |
| Shares Short (K) | 31 |
| Shares Short Prior Month (K) | |
| Stock Financials | |
|---|---|
| EPS | -21550000.000 |
| Book Value (p.s.) | |
| Profit Margin | |
| Operating Margin | -8.00 |
| Return on Assets (ttm) | 928.1 |
| Return on Equity (ttm) | -38.1 |
| Qtrly Rev. Growth | 226000.0 |
| Gross Profit (p.s.) | |
| Sales Per Share | -62.444 |
| EBITDA (p.s.) | |
| Qtrly Earnings Growth | -0.96 |
| Operating Cash Flow (M) | |
| Levered Free Cash Flow (M) | -17.39 |
| Stock Valuation | |
|---|---|
| PE Ratio | |
| PEG Ratio | |
| Price to Book value | |
| Price to Sales | -0.01 |
| Price to Cash Flow | 1.31 |
| Stock Dividends | |
|---|---|
| Dividend | |
| Dividend Yield | |
| Dividend Growth | 20700.000 |


