| PBF Energy Inc (PBF) | |||
|---|---|---|---|
| 57.39 0.84 (1.49%) | 04-23 16:00 | ||
| Open: | 56.18 | Pre. Close: | 56.55 |
| High: | 57.44 | Low: | 55.78 |
| Volume: | 1,277,574 | Market Cap: | 6,861(M) |
| Stock Technical Analysis | |
|---|---|
| Overall: |  |
| Target: | Six months: 69.86 One year: 73.44 |
| Support: | Support1: 54.85 Support2: 45.64 |
| Resistance: | Resistance1: 59.81 Resistance2: 62.88 |
| Pivot: | 58.74 |
| Moving Averages: | MA(5): 56.52 MA(20): 58.41 MA(100): 49.46 MA(250): 46.32 |
| MACD: | MACD(12,26): 0.66 Signal(12,26,9): 1.32 |
| %K %D: | %K(14,3): 22.04 %D(3): 17.30 |
| RSI: | RSI(14): 52.46 |
| 52-Week: | High: 62.88 Low: 31.26 Change(%): 66.2 |
| Average Vol(K): | 3-Month: 2169 10-Days: 1475 |
| Prices Prediction (Update @5:00pm) | ||
|---|---|---|
| If tomorrow: | Open lower | Open higher |
| High: | 57.526 - 57.758 | 57.758 - 57.997 |
| Low: | 55.217 - 55.455 | 55.455 - 55.7 |
| Close: | 56.992 - 57.413 | 57.413 - 57.847 |
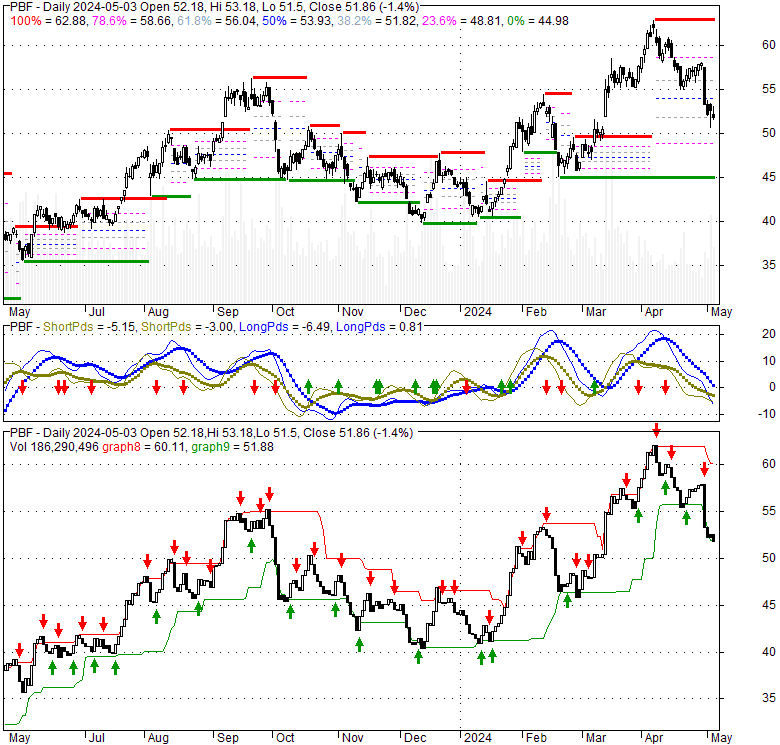
| Price, MAs and Bollinger Bands |
|---|
| Price has closed above its short-term moving average. Short-term moving average is currently above mid-term; and above long-term moving average. From the relationship between price and moving averages: This stock is BULLISH in short-term; and BULLISH in mid-long term.[ PBF ] has closed above bottom band by 32.5%. Bollinger Bands are 6.2% narrower than normal. The current width of the bands does not suggest anything about the future direction or movement of prices. |
| Company profile |
|---|
| PBF Energy Inc., together with its subsidiaries, engages in refining and supplying petroleum products. The company operates in two segments, Refining and Logistics. It produces gasoline, ultra-low-sulfur diesel, heating oil, diesel fuel, jet fuel, lubricants, petrochemicals, and asphalt, as well as unbranded transportation fuels, petrochemical feedstocks, blending components, and other petroleum products. The company sells its products in Northeast, Midwest, Gulf Coast, and West Coast of the United States, as well as in other regions of the United States, Canada, and Mexico. It also offers various rail, truck, and marine terminaling services, as well as pipeline transportation and storage services. As of December 31, 2021, the company owned and operated six oil refineries and related assets. PBF Energy Inc. was founded in 2008 and is based in Parsippany, New Jersey. |
| Stock chart |
|---|
 |
| Financial Analysis | |
|---|---|
| Price to Book Value: | Underperform |
| P/BV, a ratio used to compare book value to its current market price, to gauge whether a stock is valued properly. | |
| Price to Earnings: | Underperform |
| PE, the ratio for valuing a company that measures its current share price relative to its earnings per share (EPS). | |
| Discounted cash flow: | Outperform |
| DCF, a valuation method used to estimate the value of an investment based on its expected future cash flows. | |
| Return on Assets: | Neutral |
| ROA, indicates how profitable a company is in relation to its total assets, how efficiently uses assets to generate a profit. | |
| Return on Equity: | Underperform |
| ROE, a measure of financial performance calculated by dividing net income by equity. a gauge of profitability and efficiency. | |
| Debt to Equity: | Outperform |
| evaluate financial leverage, reflects the ability of equity to cover outstanding debts in the event of a business downturn. | |
| Stock Basics & Statistics | |
|---|---|
| Exchange: New York Stock Exchange | |
| Sector: Energy | |
| Industry: Oil & Gas Refining & Marketing | |
| Shares Out. (M) | 119.17 |
| Shares Float (M) | 102.94 |
| % Held by Insiders | 13.85 |
| % Held by Institutions | 86.24 |
| Shares Short (K) | 10740 |
| Shares Short Prior Month (K) | 9890 |
| Stock Financials | |
|---|---|
| EPS | 16.520 |
| Book Value (p.s.) | 53.870 |
| Profit Margin | 5.58 |
| Operating Margin | -0.27 |
| Return on Assets (ttm) | 9.1 |
| Return on Equity (ttm) | 37.0 |
| Qtrly Rev. Growth | -15.7 |
| Gross Profit (p.s.) | |
| Sales Per Share | 321.557 |
| EBITDA (p.s.) | 19.300 |
| Qtrly Earnings Growth | |
| Operating Cash Flow (M) | 1340.00 |
| Levered Free Cash Flow (M) | 217.08 |
| Stock Valuation | |
|---|---|
| PE Ratio | 3.47 |
| PEG Ratio | |
| Price to Book value | 1.07 |
| Price to Sales | 0.18 |
| Price to Cash Flow | 5.10 |
| Stock Dividends | |
|---|---|
| Dividend | |
| Dividend Yield | |
| Dividend Growth | |


