| Public Service Enterprise Group Inc (PEG) | |||
|---|---|---|---|
| 66.49 -0.22 (-0.33%) | 04-23 16:00 | ||
| Open: | 66.53 | Pre. Close: | 66.71 |
| High: | 67.22 | Low: | 66.29 |
| Volume: | 2,021,221 | Market Cap: | 33,151(M) |
| Stock Technical Analysis | |
|---|---|
| Overall: |  |
| Target: | Six months: 78.85 One year: 92.10 |
| Support: | Support1: 65.06 Support2: 63.54 |
| Resistance: | Resistance1: 67.51 Resistance2: 78.85 |
| Pivot: | 66.05 |
| Moving Averages: | MA(5): 65.81 MA(20): 66.14 MA(100): 62.26 MA(250): 61.83 |
| MACD: | MACD(12,26): 0.48 Signal(12,26,9): 0.62 |
| %K %D: | %K(14,3): 66.31 %D(3): 51.61 |
| RSI: | RSI(14): 58.80 |
| 52-Week: | High: 67.51 Low: 53.71 Change(%): 4.1 |
| Average Vol(K): | 3-Month: 2913 10-Days: 2279 |
| Prices Prediction (Update @5:00pm) | ||
|---|---|---|
| If tomorrow: | Open lower | Open higher |
| High: | 67.274 - 67.614 | 67.614 - 67.832 |
| Low: | 65.47 - 65.926 | 65.926 - 66.217 |
| Close: | 65.838 - 66.524 | 66.524 - 66.962 |
| Price, MAs and Bollinger Bands |
|---|
| Price has closed above its short-term moving average. Short-term moving average is currently above mid-term; and above long-term moving average. From the relationship between price and moving averages: This stock is BULLISH in short-term; and BULLISH in mid-long term.[ PEG ] has closed below upper band by 36.0%. Bollinger Bands are 20.9% narrower than normal. The current width of the bands does not suggest anything about the future direction or movement of prices. |
| Company profile |
|---|
| Public Service Enterprise Group Incorporated, through its subsidiaries, operates as an energy company primarily in the Northeastern and Mid-Atlantic United States. It operates through two segments, PSE&G and PSEG Power. The PSE&G segment transmits electricity; distributes electricity and gas to residential, commercial, and industrial customers, as well as invests in solar generation projects, and energy efficiency and related programs; and offers appliance services and repairs. As of December 31, 2021, it had electric transmission and distribution system of 25,000 circuit miles and 862,000 poles; 56 switching stations with an installed capacity of 39,353 megavolt-amperes (MVA), and 235 substations with an installed capacity of 9,285 MVA; four electric distribution headquarters and five electric sub-headquarters; and 18,000 miles of gas mains, 12 gas distribution headquarters, two sub-headquarters, and one meter shop, as well as 58 natural gas metering and regulating stations. Public Service Enterprise Group Incorporated was incorporated in 1985 and is based in Newark, New Jersey. |
| Stock chart |
|---|
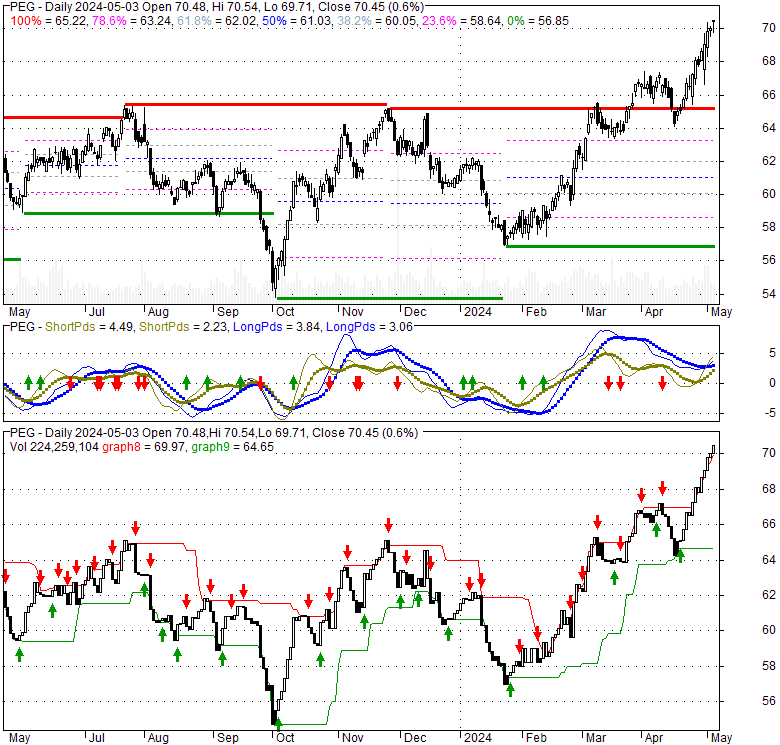 |
| Financial Analysis | |
|---|---|
| Price to Book Value: | Outperform |
| P/BV, a ratio used to compare book value to its current market price, to gauge whether a stock is valued properly. | |
| Price to Earnings: | Outperform |
| PE, the ratio for valuing a company that measures its current share price relative to its earnings per share (EPS). | |
| Discounted cash flow: | Outperform |
| DCF, a valuation method used to estimate the value of an investment based on its expected future cash flows. | |
| Return on Assets: | Outperform |
| ROA, indicates how profitable a company is in relation to its total assets, how efficiently uses assets to generate a profit. | |
| Return on Equity: | Outperform |
| ROE, a measure of financial performance calculated by dividing net income by equity. a gauge of profitability and efficiency. | |
| Debt to Equity: | Neutral |
| evaluate financial leverage, reflects the ability of equity to cover outstanding debts in the event of a business downturn. | |
| Stock Basics & Statistics | |
|---|---|
| Exchange: New York Stock Exchange | |
| Sector: Utilities | |
| Industry: Regulated Electric | |
| Shares Out. (M) | 498.59 |
| Shares Float (M) | 497.23 |
| % Held by Insiders | 0.12 |
| % Held by Institutions | 75.18 |
| Shares Short (K) | 7040 |
| Shares Short Prior Month (K) | 6640 |
| Stock Financials | |
|---|---|
| EPS | 5.130 |
| Book Value (p.s.) | 31.080 |
| Profit Margin | 22.81 |
| Operating Margin | 27.87 |
| Return on Assets (ttm) | 4.4 |
| Return on Equity (ttm) | 17.5 |
| Qtrly Rev. Growth | -17.0 |
| Gross Profit (p.s.) | |
| Sales Per Share | 22.544 |
| EBITDA (p.s.) | 9.627 |
| Qtrly Earnings Growth | -30.70 |
| Operating Cash Flow (M) | 3810.00 |
| Levered Free Cash Flow (M) | 25.75 |
| Stock Valuation | |
|---|---|
| PE Ratio | 12.96 |
| PEG Ratio | 3.38 |
| Price to Book value | 2.14 |
| Price to Sales | 2.95 |
| Price to Cash Flow | 8.70 |
| Stock Dividends | |
|---|---|
| Dividend | |
| Dividend Yield | |
| Dividend Growth | |


