| Anaplan Inc (PLAN) | |||
|---|---|---|---|
| 63.73 0.37 (0.58%) | 12-31 19:00 | ||
| Open: | 63.7 | Pre. Close: | 63.36 |
| High: | 63.74 | Low: | 63.66 |
| Volume: | 8,356,048 | Market Cap: | 9,593(M) |
| Stock Technical Analysis | |
|---|---|
| Overall: |  |
| Target: | Six months: 74.45 One year: 86.96 |
| Support: | Support1: 63.69 Support2: 63.66 |
| Resistance: | Resistance1: 63.74 Resistance2: 74.45 |
| Pivot: | 63.73 |
| Moving Averages: | MA(5): 63.73 MA(20): 63.73 MA(100): 63.73 MA(250): 58.36 |
| MACD: | MACD(12,26): Signal(12,26,9): |
| %K %D: | %K(14,3): 87.50 %D(3): 87.50 |
| RSI: | RSI(14): 46.02 |
| 52-Week: | High: 70.25 Low: 39.92 Change(%): 44.1 |
| Average Vol(K): | 3-Month: 8356 10-Days: 8356 |
| Prices Prediction (Update @5:00pm) | ||
|---|---|---|
| If tomorrow: | Open lower | Open higher |
| High: | 63.889 - 64.203 | 64.203 - 64.458 |
| Low: | 62.769 - 63.207 | 63.207 - 63.563 |
| Close: | 63.123 - 63.779 | 63.779 - 64.312 |
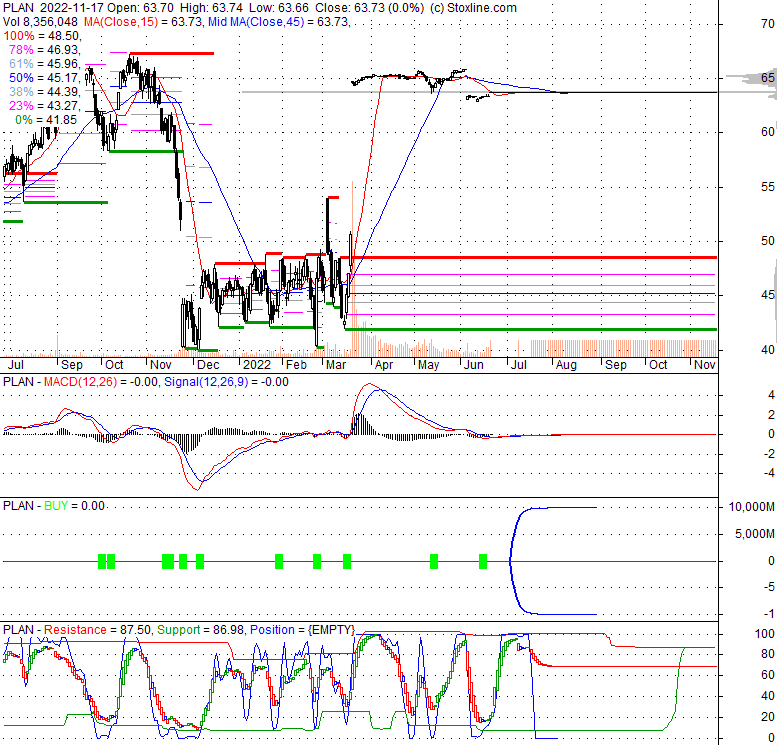
| Price, MAs and Bollinger Bands |
|---|
| Price has closed below its short-term moving average. Short-term moving average is currently below mid-term; and below long-term moving average. From the relationship between price and moving averages: This stock is NEUTRAL in short-term; and NEUTRAL in mid-long term.[ PLAN ] has closed Bollinger Bands are 100% narrower than normal. The narrow width of the bands suggests low volatility as compared to its normal range. The bands have been in this narrow range for 107 bars. This is a sign that the market may be about to initiate a new trend. |
| Company profile |
|---|
| Anaplan, Inc. provides a cloud-based connected planning platform to connect organizations and people in the Americas, Europe, the Middle East, Africa, and the Asia Pacific. Its platform in-memory data storage and calculation capabilities deliver calculations of data in real time and provide a single source of information for planning, ensuring the consistency, quality, and integrity of the data utilized across the enterprise. The company delivers its application over the Internet as a subscription service using a software-as-a-service model, as well as offers professional services related to implementing and supporting its application. It serves banking, capital markets, consumer products, healthcare, insurance, life science, media, professional services, retail, technology, telecom, and transportation industries, as well as government agencies. Anaplan, Inc. was founded in 2008 and is headquartered in San Francisco, California. |
| Stock chart |
|---|
 |
| Stock News |
|---|
|
Fri, 19 Apr 2024 Earnings Preview: Anaplan (PLAN) Q3 Earnings Expected to Decline - Yahoo Movies Canada Sun, 08 Oct 2023 Top 20 Anaplan Competitors and Alternatives - Business Strategy Hub Mon, 18 Sep 2023 2000-employee Anaplan to relocate its HQ to Miami early next year - Refresh Miami Tue, 23 May 2023 GANT partners with Anaplan and Bedford Consulting - Retail Insight Network Wed, 22 Jun 2022 Thoma Bravo Completes Acquisition of Anaplan - Business Wire Thu, 09 Jun 2022 Anaplan, Thoma Bravo Reprice Deal - The Deal Pipeline |
| Financial Analysis | |
|---|---|
| Price to Book Value: | Outperform |
| P/BV, a ratio used to compare book value to its current market price, to gauge whether a stock is valued properly. | |
| Price to Earnings: | Underperform |
| PE, the ratio for valuing a company that measures its current share price relative to its earnings per share (EPS). | |
| Discounted cash flow: | Outperform |
| DCF, a valuation method used to estimate the value of an investment based on its expected future cash flows. | |
| Return on Assets: | Neutral |
| ROA, indicates how profitable a company is in relation to its total assets, how efficiently uses assets to generate a profit. | |
| Return on Equity: | Underperform |
| ROE, a measure of financial performance calculated by dividing net income by equity. a gauge of profitability and efficiency. | |
| Debt to Equity: | Outperform |
| evaluate financial leverage, reflects the ability of equity to cover outstanding debts in the event of a business downturn. | |
| Stock Basics & Statistics | |
|---|---|
| Exchange: New York Stock Exchange | |
| Sector: Technology | |
| Industry: Software - Infrastructure | |
| Shares Out. (M) | |
| Shares Float (M) | 150.53 |
| % Held by Insiders | 148710000.00 |
| % Held by Institutions | 2.59 |
| Shares Short (K) | 15680 |
| Shares Short Prior Month (K) | |
| Stock Financials | |
|---|---|
| EPS | -193780000.000 |
| Book Value (p.s.) | |
| Profit Margin | |
| Operating Margin | -33.25 |
| Return on Assets (ttm) | -33.4 |
| Return on Equity (ttm) | -17.7 |
| Qtrly Rev. Growth | 631510016.0 |
| Gross Profit (p.s.) | 17.119 |
| Sales Per Share | -46.605 |
| EBITDA (p.s.) | 246231648.000 |
| Qtrly Earnings Growth | -1.42 |
| Operating Cash Flow (M) | |
| Levered Free Cash Flow (M) | -14.52 |
| Stock Valuation | |
|---|---|
| PE Ratio | |
| PEG Ratio | 124.33 |
| Price to Book value | |
| Price to Sales | -1.37 |
| Price to Cash Flow | 68.78 |
| Stock Dividends | |
|---|---|
| Dividend | |
| Dividend Yield | |
| Dividend Growth | 17850000.000 |


