| Palantir Technologies Inc Cl A (PLTR) | |||
|---|---|---|---|
| 21.13 -0.18 (-0.84%) | 04-18 16:00 | ||
| Open: | 21.25 | Pre. Close: | 21.31 |
| High: | 21.43 | Low: | 20.7 |
| Volume: | 34,111,159 | Market Cap: | 44,603(M) |
| Stock Technical Analysis | |
|---|---|
| Overall: |  |
| Target: | Six months: 27.63 One year: 29.76 |
| Support: | Support1: 20.70 Support2: 17.22 |
| Resistance: | Resistance1: 23.65 Resistance2: 25.48 |
| Pivot: | 22.45 |
| Moving Averages: | MA(5): 21.78 MA(20): 22.96 MA(100): 20.68 MA(250): 17.34 |
| MACD: | MACD(12,26): -0.55 Signal(12,26,9): -0.32 |
| %K %D: | %K(14,3): 9.54 %D(3): 10.50 |
| RSI: | RSI(14): 33.77 |
| 52-Week: | High: 27.5 Low: 7.28 Change(%): 159.3 |
| Average Vol(K): | 3-Month: 70393 10-Days: 31764 |
| Prices Prediction (Update @5:00pm) | ||
|---|---|---|
| If tomorrow: | Open lower | Open higher |
| High: | 21.57 - 21.777 | 21.777 - 21.902 |
| Low: | 20.263 - 20.532 | 20.532 - 20.694 |
| Close: | 20.819 - 21.261 | 21.261 - 21.528 |
| Price, MAs and Bollinger Bands |
|---|
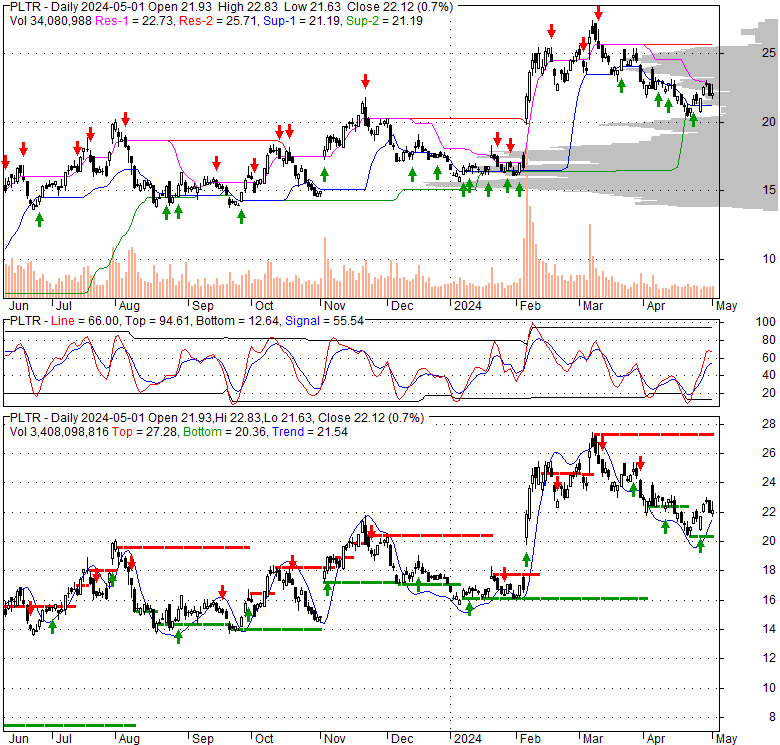
| Price has closed below its short-term moving average. Short-term moving average is currently below mid-term; and above long-term moving average. From the relationship between price and moving averages: This stock is BEARISH in short-term; and NEUTRAL in mid-long term.[ PLTR ] has closed below the lower bollinger band by 6.0%. If price is in a downtrend band; this downward trend might continue. However a short term pullback inside the band is likely. Bollinger Bands are 44% narrower than normal. The narrow width of the bands suggests low volatility as compared to its normal range. The bands have been in this narrow range for 0 bars. This is a sign that the market may be about to initiate a new trend. |
| Company profile |
|---|
| Palantir Technologies Inc. builds and deploys software platforms for the intelligence community in the United States to assist in counterterrorism investigations and operations. The company provides palantir gotham, a software platform which enables users to identify patterns hidden deep within datasets, ranging from signals intelligence sources to reports from confidential informants, as well as facilitates the handoff between analysts and operational users, helping operators plan and execute real-world responses to threats that have been identified within the platform. It also offers palantir foundry, a platform that transforms the ways organizations operate by creating a central operating system for their data; and allows individual users to integrate and analyze the data they need in one place. In addition, it provides apollo, a software that enables customers to deploy their own software virtually in any environment. Palantir Technologies Inc. was incorporated in 2003 and is based in Denver, Colorado. |
| Stock chart |
|---|
 |
| Financial Analysis | |
|---|---|
| Price to Book Value: | Outperform |
| P/BV, a ratio used to compare book value to its current market price, to gauge whether a stock is valued properly. | |
| Price to Earnings: | Outperform |
| PE, the ratio for valuing a company that measures its current share price relative to its earnings per share (EPS). | |
| Discounted cash flow: | Neutral |
| DCF, a valuation method used to estimate the value of an investment based on its expected future cash flows. | |
| Return on Assets: | Outperform |
| ROA, indicates how profitable a company is in relation to its total assets, how efficiently uses assets to generate a profit. | |
| Return on Equity: | Outperform |
| ROE, a measure of financial performance calculated by dividing net income by equity. a gauge of profitability and efficiency. | |
| Debt to Equity: | Neutral |
| evaluate financial leverage, reflects the ability of equity to cover outstanding debts in the event of a business downturn. | |
| Stock Basics & Statistics | |
|---|---|
| Exchange: New York Stock Exchange | |
| Sector: Technology | |
| Industry: Software - Infrastructure | |
| Shares Out. (M) | 2110.00 |
| Shares Float (M) | 1990.00 |
| % Held by Insiders | 6.19 |
| % Held by Institutions | 41.55 |
| Shares Short (K) | 82370 |
| Shares Short Prior Month (K) | 97080 |
| Stock Financials | |
|---|---|
| EPS | 0.090 |
| Book Value (p.s.) | 1.580 |
| Profit Margin | 9.43 |
| Operating Margin | 10.81 |
| Return on Assets (ttm) | 1.9 |
| Return on Equity (ttm) | 7.0 |
| Qtrly Rev. Growth | 19.6 |
| Gross Profit (p.s.) | |
| Sales Per Share | 1.057 |
| EBITDA (p.s.) | 0.073 |
| Qtrly Earnings Growth | 166.30 |
| Operating Cash Flow (M) | 712.18 |
| Levered Free Cash Flow (M) | 659.42 |
| Stock Valuation | |
|---|---|
| PE Ratio | 234.78 |
| PEG Ratio | 0.81 |
| Price to Book value | 13.37 |
| Price to Sales | 19.99 |
| Price to Cash Flow | 62.60 |
| Stock Dividends | |
|---|---|
| Dividend | |
| Dividend Yield | |
| Dividend Growth | |