| Restaurant Brands International (QSR) | |||
|---|---|---|---|
| 73.07 -0.55 (-0.75%) | 04-25 16:00 | ||
| Open: | 72.9 | Pre. Close: | 73.62 |
| High: | 73.57 | Low: | 72.34 |
| Volume: | 1,182,392 | Market Cap: | 22,896(M) |
| Stock Technical Analysis | |
|---|---|
| Overall: |  |
| Target: | Six months: 89.64 One year: 94.92 |
| Support: | Support1: 69.42 Support2: 57.76 |
| Resistance: | Resistance1: 76.74 Resistance2: 81.27 |
| Pivot: | 72.55 |
| Moving Averages: | MA(5): 73.15 MA(20): 73.77 MA(100): 76.49 MA(250): 73.25 |
| MACD: | MACD(12,26): -1.34 Signal(12,26,9): -1.59 |
| %K %D: | %K(14,3): 57.81 %D(3): 49.57 |
| RSI: | RSI(14): 42.54 |
| 52-Week: | High: 83.285 Low: 61.77 Change(%): 5.0 |
| Average Vol(K): | 3-Month: 1525 10-Days: 1332 |
| Prices Prediction (Update @5:00pm) | ||
|---|---|---|
| If tomorrow: | Open lower | Open higher |
| High: | 73.646 - 74.048 | 74.048 - 74.381 |
| Low: | 71.354 - 71.861 | 71.861 - 72.282 |
| Close: | 72.303 - 73.08 | 73.08 - 73.725 |
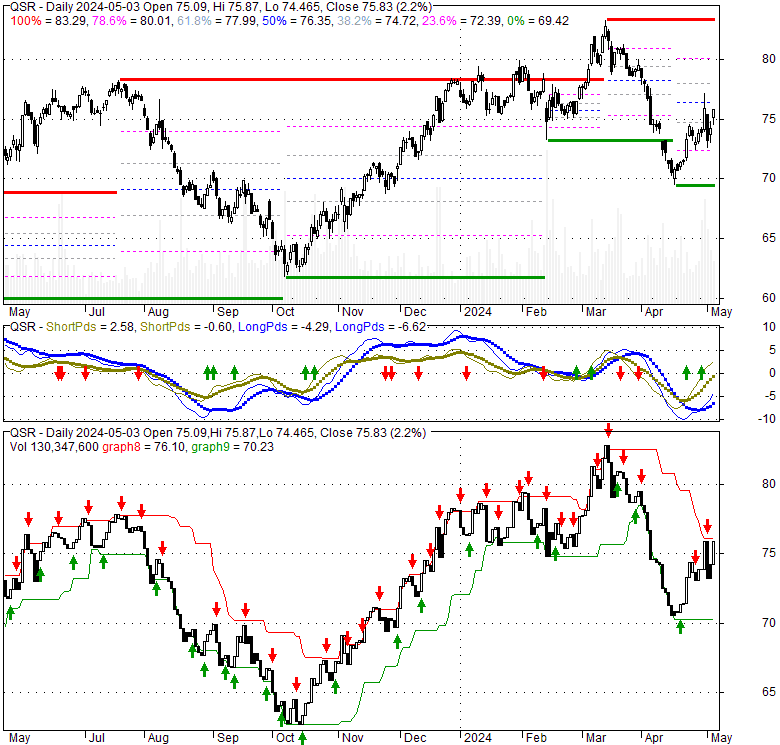
| Price, MAs and Bollinger Bands |
|---|
| Price has closed below its short-term moving average. Short-term moving average is currently below mid-term; and below long-term moving average. From the relationship between price and moving averages: This stock is BEARISH in short-term; and NEUTRAL in mid-long term.[ QSR ] has closed below upper band by 40.9%. Bollinger Bands are 5.2% narrower than normal. The current width of the bands does not suggest anything about the future direction or movement of prices. |
| Company profile |
|---|
| Restaurant Brands International Inc. operates as quick service restaurant company in Canada and internationally. It operates through four segments: Tim Hortons (TH), Burger King (BK), Popeyes Louisiana Kitchen (PLK), and Firehouse Subs (FHS). The company owns and franchises TH chain of donut/coffee/tea restaurants that offer blend coffee, tea, and espresso-based hot and cold specialty drinks; and fresh baked goods, including donuts, Timbits, bagels, muffins, cookies and pastries, grilled paninis, classic sandwiches, wraps, soups, and others. It is also involved in owning and franchising BK, a fast food hamburger restaurant chain, which offers flame-grilled hamburgers, chicken and other specialty sandwiches, french fries, soft drinks, and other food items; and PLK quick service restaurants that provide Louisiana style fried chicken, chicken tenders, fried shrimp and other seafood, red beans and rice, and other regional items. In addition, the company owns and franchises FHS restaurants quick service restaurants that offer subs, soft drinks, and local specialties. As of February 15, 2022, the company had approximately 29,000 restaurants in 100 countries under the Tim Hortons, Burger King, Popeyes, And Firehouse Subs brands. Restaurant Brands International Inc. was founded in 1954 and is headquartered in Toronto, Canada. |
| Stock chart |
|---|
 |
| Financial Analysis | |
|---|---|
| Price to Book Value: | Outperform |
| P/BV, a ratio used to compare book value to its current market price, to gauge whether a stock is valued properly. | |
| Price to Earnings: | Neutral |
| PE, the ratio for valuing a company that measures its current share price relative to its earnings per share (EPS). | |
| Discounted cash flow: | Neutral |
| DCF, a valuation method used to estimate the value of an investment based on its expected future cash flows. | |
| Return on Assets: | Outperform |
| ROA, indicates how profitable a company is in relation to its total assets, how efficiently uses assets to generate a profit. | |
| Return on Equity: | Outperform |
| ROE, a measure of financial performance calculated by dividing net income by equity. a gauge of profitability and efficiency. | |
| Debt to Equity: | Outperform |
| evaluate financial leverage, reflects the ability of equity to cover outstanding debts in the event of a business downturn. | |
| Stock Basics & Statistics | |
|---|---|
| Exchange: New York Stock Exchange | |
| Sector: Consumer Cyclical | |
| Industry: Restaurants | |
| Shares Out. (M) | 313.35 |
| Shares Float (M) | 285.20 |
| % Held by Insiders | 1.41 |
| % Held by Institutions | 87.85 |
| Shares Short (K) | 9100 |
| Shares Short Prior Month (K) | 8250 |
| Stock Financials | |
|---|---|
| EPS | 3.760 |
| Book Value (p.s.) | 9.170 |
| Profit Margin | 16.95 |
| Operating Margin | 27.03 |
| Return on Assets (ttm) | 5.8 |
| Return on Equity (ttm) | 38.2 |
| Qtrly Rev. Growth | 7.8 |
| Gross Profit (p.s.) | |
| Sales Per Share | 22.403 |
| EBITDA (p.s.) | 7.436 |
| Qtrly Earnings Growth | 118.50 |
| Operating Cash Flow (M) | 1320.00 |
| Levered Free Cash Flow (M) | 1120.00 |
| Stock Valuation | |
|---|---|
| PE Ratio | 19.43 |
| PEG Ratio | 2.24 |
| Price to Book value | 7.97 |
| Price to Sales | 3.26 |
| Price to Cash Flow | 17.35 |
| Stock Dividends | |
|---|---|
| Dividend | |
| Dividend Yield | |
| Dividend Growth | |


