| Royal Caribbean Cruises Ltd (RCL) | |||
|---|---|---|---|
| 129.21 1.57 (1.23%) | 04-19 16:00 | ||
| Open: | 128 | Pre. Close: | 127.64 |
| High: | 129.72 | Low: | 127.2 |
| Volume: | 2,926,192 | Market Cap: | 33,162(M) |
| Stock Technical Analysis | |
|---|---|
| Overall: |  |
| Target: | Six months: 158.08 One year: 165.51 |
| Support: | Support1: 125.06 Support2: 104.05 |
| Resistance: | Resistance1: 135.34 Resistance2: 141.70 |
| Pivot: | 132.66 |
| Moving Averages: | MA(5): 127.72 MA(20): 133.89 MA(100): 124.75 MA(250): 105.28 |
| MACD: | MACD(12,26): -0.58 Signal(12,26,9): 0.69 |
| %K %D: | %K(14,3): 19.31 %D(3): 14.76 |
| RSI: | RSI(14): 46.45 |
| 52-Week: | High: 141.7 Low: 59.37 Change(%): 105.0 |
| Average Vol(K): | 3-Month: 2843 10-Days: 2750 |
| Prices Prediction (Update @5:00pm) | ||
|---|---|---|
| If tomorrow: | Open lower | Open higher |
| High: | 129.833 - 130.748 | 130.748 - 131.458 |
| Low: | 125.483 - 126.457 | 126.457 - 127.213 |
| Close: | 127.94 - 129.446 | 129.446 - 130.615 |
| Price, MAs and Bollinger Bands |
|---|
| Price has closed above its short-term moving average. Short-term moving average is currently below mid-term; and above long-term moving average. From the relationship between price and moving averages: This stock is NEUTRAL in short-term; and NEUTRAL in mid-long term.[ RCL ] has closed above bottom band by 31.4%. Bollinger Bands are 23.9% wider than normal. The current width of the bands does not suggest anything about the future direction or movement of prices. |
| Company profile |
|---|
| Royal Caribbean Cruises Ltd. operates as a cruise company worldwide. The company operates cruises under the Royal Caribbean International, Celebrity Cruises, Azamara, and Silversea Cruises brands, which comprise a range of itineraries that call on approximately 1,000 destinations. As of February 25, 2022, it operated 61 ships. The company was founded in 1968 and is headquartered in Miami, Florida. |
| Stock chart |
|---|
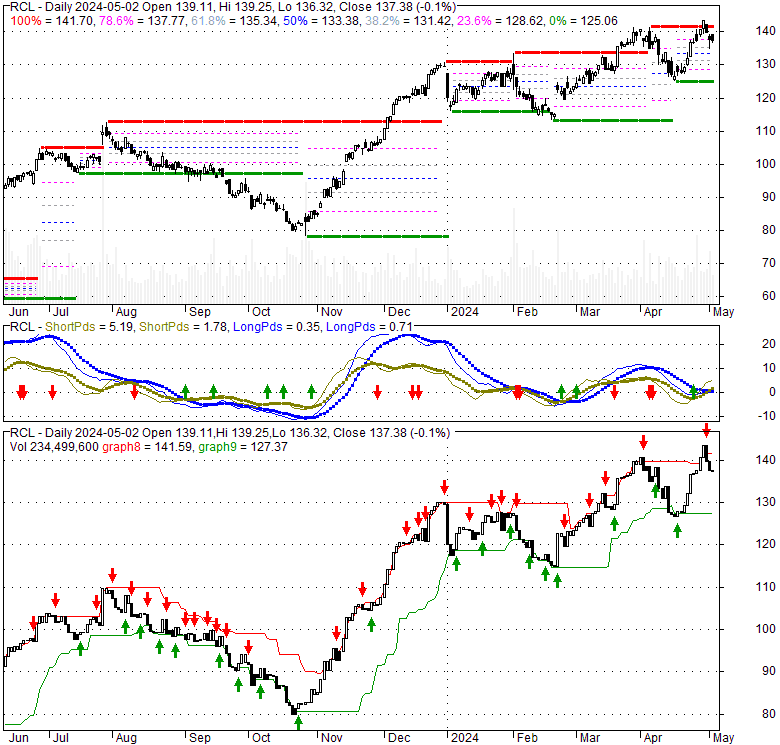 |
| Financial Analysis | |
|---|---|
| Price to Book Value: | Outperform |
| P/BV, a ratio used to compare book value to its current market price, to gauge whether a stock is valued properly. | |
| Price to Earnings: | Outperform |
| PE, the ratio for valuing a company that measures its current share price relative to its earnings per share (EPS). | |
| Discounted cash flow: | Neutral |
| DCF, a valuation method used to estimate the value of an investment based on its expected future cash flows. | |
| Return on Assets: | Neutral |
| ROA, indicates how profitable a company is in relation to its total assets, how efficiently uses assets to generate a profit. | |
| Return on Equity: | Outperform |
| ROE, a measure of financial performance calculated by dividing net income by equity. a gauge of profitability and efficiency. | |
| Debt to Equity: | Outperform |
| evaluate financial leverage, reflects the ability of equity to cover outstanding debts in the event of a business downturn. | |
| Stock Basics & Statistics | |
|---|---|
| Exchange: New York Stock Exchange | |
| Sector: Consumer Cyclical | |
| Industry: Travel Services | |
| Shares Out. (M) | 256.65 |
| Shares Float (M) | 240.72 |
| % Held by Insiders | 7.95 |
| % Held by Institutions | 80.93 |
| Shares Short (K) | 15360 |
| Shares Short Prior Month (K) | 15130 |
| Stock Financials | |
|---|---|
| EPS | 6.310 |
| Book Value (p.s.) | 18.420 |
| Profit Margin | 12.21 |
| Operating Margin | 17.42 |
| Return on Assets (ttm) | 5.3 |
| Return on Equity (ttm) | 43.9 |
| Qtrly Rev. Growth | 28.0 |
| Gross Profit (p.s.) | |
| Sales Per Share | 54.159 |
| EBITDA (p.s.) | 16.949 |
| Qtrly Earnings Growth | |
| Operating Cash Flow (M) | 4480.00 |
| Levered Free Cash Flow (M) | -87.50 |
| Stock Valuation | |
|---|---|
| PE Ratio | 20.48 |
| PEG Ratio | 0.48 |
| Price to Book value | 7.01 |
| Price to Sales | 2.38 |
| Price to Cash Flow | 7.40 |
| Stock Dividends | |
|---|---|
| Dividend | |
| Dividend Yield | |
| Dividend Growth | |


