| Retail Opp Invts Cp (ROIC) | |||
|---|---|---|---|
| 12.31 -0.09 (-0.73%) | 04-25 13:36 | ||
| Open: | 12.24 | Pre. Close: | 12.4 |
| High: | 12.35 | Low: | 12.16 |
| Volume: | 285,641 | Market Cap: | 1,563(M) |
| Stock Technical Analysis | |
|---|---|
| Overall: |  |
| Target: | Six months: 14.63 One year: 15.10 |
| Support: | Support1: 11.88 Support2: 9.88 |
| Resistance: | Resistance1: 12.53 Resistance2: 12.93 |
| Pivot: | 12.34 |
| Moving Averages: | MA(5): 12.38 MA(20): 12.37 MA(100): 13.22 MA(250): 13.09 |
| MACD: | MACD(12,26): -0.11 Signal(12,26,9): -0.14 |
| %K %D: | %K(14,3): 55.26 %D(3): 56.36 |
| RSI: | RSI(14): 45.69 |
| 52-Week: | High: 15.17 Low: 10.99 Change(%): -3.8 |
| Average Vol(K): | 3-Month: 1229 10-Days: 922 |
| Prices Prediction (Update @5:00pm) | ||
|---|---|---|
| If tomorrow: | Open lower | Open higher |
| High: | 12.67 - 12.734 | 12.734 - 12.775 |
| Low: | 12.187 - 12.272 | 12.272 - 12.326 |
| Close: | 12.278 - 12.406 | 12.406 - 12.488 |
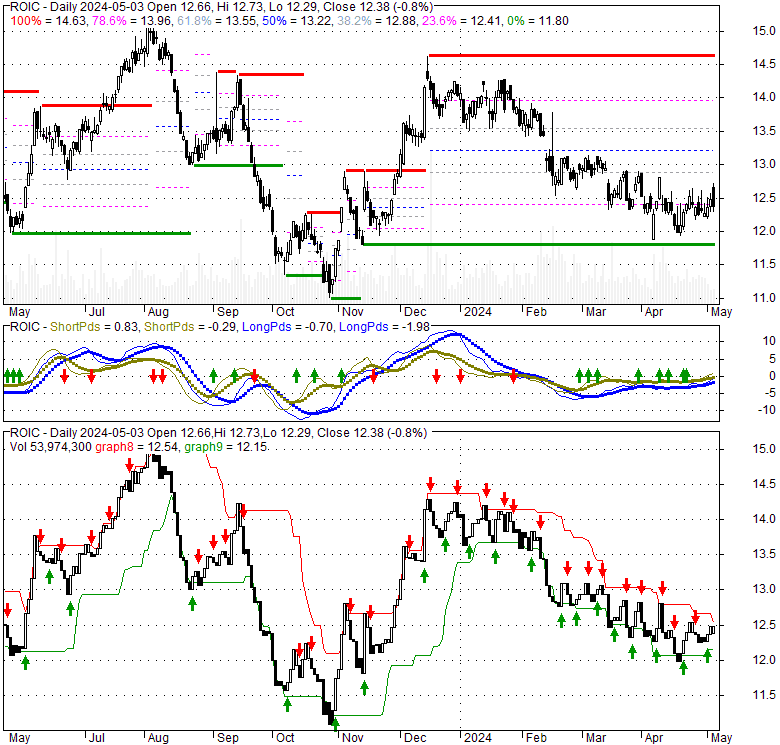
| Price, MAs and Bollinger Bands |
|---|
| Price has closed below its short-term moving average. Short-term moving average is currently below mid-term; and below long-term moving average. From the relationship between price and moving averages: This stock is BEARISH in short-term; and BEARISH in mid-long term.[ ROIC ] has closed above bottom band by 43.4%. Bollinger Bands are 22.5% narrower than normal. The current width of the bands does not suggest anything about the future direction or movement of prices. |
| Company profile |
|---|
| Retail Opportunity Investments Corp. (NASDAQ: ROIC), is a fully-integrated, self-managed real estate investment trust (REIT) that specializes in the acquisition, ownership and management of grocery-anchored shopping centers located in densely populated, metropolitan markets across the West Coast. As of September 30, 2020, ROIC owned 88 shopping centers encompassing approximately 10.1 million square feet. ROIC is the largest publicly-traded, grocery-anchored shopping center REIT focused exclusively on the West Coast. ROIC is a member of the S&P SmallCap 600 Index and has investment-grade corporate debt ratings from Moody's Investor Services, S&P Global Ratings, and Fitch Ratings, Inc. |
| Stock chart |
|---|
 |
| Stock News |
|---|
|
Mon, 15 Sep 2014 3 Buy-Rated Dividend Stocks: ROIC, HCP, BGS - TheStreet Thu, 25 Apr 2024 Thu, 25 Apr 2024 Thu, 25 Apr 2024 Thu, 25 Apr 2024 Thu, 25 Apr 2024 |
| Financial Analysis | |
|---|---|
| Price to Book Value: | Underperform |
| P/BV, a ratio used to compare book value to its current market price, to gauge whether a stock is valued properly. | |
| Price to Earnings: | Neutral |
| PE, the ratio for valuing a company that measures its current share price relative to its earnings per share (EPS). | |
| Discounted cash flow: | Outperform |
| DCF, a valuation method used to estimate the value of an investment based on its expected future cash flows. | |
| Return on Assets: | Neutral |
| ROA, indicates how profitable a company is in relation to its total assets, how efficiently uses assets to generate a profit. | |
| Return on Equity: | Neutral |
| ROE, a measure of financial performance calculated by dividing net income by equity. a gauge of profitability and efficiency. | |
| Debt to Equity: | Underperform |
| evaluate financial leverage, reflects the ability of equity to cover outstanding debts in the event of a business downturn. | |
| Stock Basics & Statistics | |
|---|---|
| Exchange: NASDAQ Global Select | |
| Sector: Real Estate | |
| Industry: REIT - Retail | |
| Shares Out. (M) | 127.46 |
| Shares Float (M) | 122.75 |
| % Held by Insiders | 3.26 |
| % Held by Institutions | 105.43 |
| Shares Short (K) | 3220 |
| Shares Short Prior Month (K) | 3830 |
| Stock Financials | |
|---|---|
| EPS | 0.270 |
| Book Value (p.s.) | 10.140 |
| Profit Margin | 10.54 |
| Operating Margin | 34.39 |
| Return on Assets (ttm) | 2.3 |
| Return on Equity (ttm) | 2.7 |
| Qtrly Rev. Growth | 5.6 |
| Gross Profit (p.s.) | |
| Sales Per Share | 2.571 |
| EBITDA (p.s.) | 1.592 |
| Qtrly Earnings Growth | -22.40 |
| Operating Cash Flow (M) | 147.48 |
| Levered Free Cash Flow (M) | 170.98 |
| Stock Valuation | |
|---|---|
| PE Ratio | 45.50 |
| PEG Ratio | 5.60 |
| Price to Book value | 1.21 |
| Price to Sales | 4.78 |
| Price to Cash Flow | 10.62 |
| Stock Dividends | |
|---|---|
| Dividend | |
| Dividend Yield | |
| Dividend Growth | |


