| Sprouts Farmers Market (SFM) | |||
|---|---|---|---|
| 62.32 -0.18 (-0.29%) | 04-15 16:00 | ||
| Open: | 63.16 | Pre. Close: | 62.5 |
| High: | 63.42 | Low: | 62.24 |
| Volume: | 799,981 | Market Cap: | 6,308(M) |
| Stock Technical Analysis | |
|---|---|
| Overall: |  |
| Target: | Six months: 73.87 One year: 75.88 |
| Support: | Support1: 60.46 Support2: 50.30 |
| Resistance: | Resistance1: 63.25 Resistance2: 64.97 |
| Pivot: | 63.49 |
| Moving Averages: | MA(5): 63.25 MA(20): 63.25 MA(100): 53.74 MA(250): 44.57 |
| MACD: | MACD(12,26): 0.75 Signal(12,26,9): 1.14 |
| %K %D: | %K(14,3): 40.58 %D(3): 57.86 |
| RSI: | RSI(14): 49.64 |
| 52-Week: | High: 65.53 Low: 32.12 Change(%): 84.5 |
| Average Vol(K): | 3-Month: 1320 10-Days: 1027 |
| Prices Prediction (Update @5:00pm) | ||
|---|---|---|
| If tomorrow: | Open lower | Open higher |
| High: | 63.447 - 63.874 | 63.874 - 64.227 |
| Low: | 61.418 - 61.836 | 61.836 - 62.182 |
| Close: | 61.711 - 62.386 | 62.386 - 62.945 |
| Price, MAs and Bollinger Bands |
|---|
| Price has closed below its short-term moving average. Short-term moving average is currently above mid-term; and above long-term moving average. From the relationship between price and moving averages: This stock is NEUTRAL in short-term; and BULLISH in mid-long term.[ SFM ] has closed above bottom band by 4.0%. Bollinger Bands are 53.9% narrower than normal. The narrow width of the bands suggests low volatility as compared to its normal range. The bands have been in this narrow range for 5 bars. This is a sign that the market may be about to initiate a new trend. |
| Company profile |
|---|
| Sprouts Farmers Market, Inc. offers fresh, natural, and organic food products in the United States. The company offers perishable product categories, including fresh produce, meat, seafood, deli, bakery, floral and dairy, and dairy alternatives; and non-perishable product categories, such as grocery, vitamins and supplements, bulk items, frozen foods, beer and wine, and natural health and body care. As of January 2, 2022, it operated 374 stores in 23 states. Sprouts Farmers Market, Inc. was founded in 2002 and is headquartered in Phoenix, Arizona. |
| Stock chart |
|---|
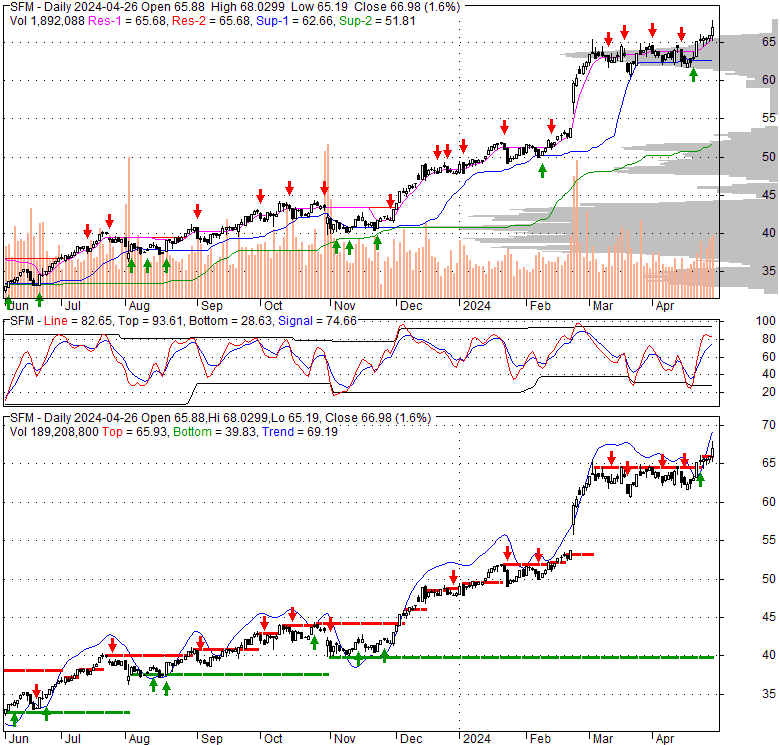 |
| Financial Analysis | |
|---|---|
| Price to Book Value: | Outperform |
| P/BV, a ratio used to compare book value to its current market price, to gauge whether a stock is valued properly. | |
| Price to Earnings: | Outperform |
| PE, the ratio for valuing a company that measures its current share price relative to its earnings per share (EPS). | |
| Discounted cash flow: | Outperform |
| DCF, a valuation method used to estimate the value of an investment based on its expected future cash flows. | |
| Return on Assets: | Outperform |
| ROA, indicates how profitable a company is in relation to its total assets, how efficiently uses assets to generate a profit. | |
| Return on Equity: | Outperform |
| ROE, a measure of financial performance calculated by dividing net income by equity. a gauge of profitability and efficiency. | |
| Debt to Equity: | Outperform |
| evaluate financial leverage, reflects the ability of equity to cover outstanding debts in the event of a business downturn. | |
| Stock Basics & Statistics | |
|---|---|
| Exchange: NASDAQ Global Select | |
| Sector: Consumer Defensive | |
| Industry: Grocery Stores | |
| Shares Out. (M) | 100.85 |
| Shares Float (M) | 100.59 |
| % Held by Insiders | 0.62 |
| % Held by Institutions | 117.14 |
| Shares Short (K) | 15270 |
| Shares Short Prior Month (K) | 14160 |
| Stock Financials | |
|---|---|
| EPS | 2.500 |
| Book Value (p.s.) | 11.350 |
| Profit Margin | 3.79 |
| Operating Margin | 4.25 |
| Return on Assets (ttm) | 7.6 |
| Return on Equity (ttm) | 23.6 |
| Qtrly Rev. Growth | 7.7 |
| Gross Profit (p.s.) | |
| Sales Per Share | 67.824 |
| EBITDA (p.s.) | 5.142 |
| Qtrly Earnings Growth | 17.60 |
| Operating Cash Flow (M) | 465.07 |
| Levered Free Cash Flow (M) | 303.47 |
| Stock Valuation | |
|---|---|
| PE Ratio | 24.93 |
| PEG Ratio | 2.57 |
| Price to Book value | 5.49 |
| Price to Sales | 0.92 |
| Price to Cash Flow | 13.51 |
| Stock Dividends | |
|---|---|
| Dividend | |
| Dividend Yield | |
| Dividend Growth | |


