| Smith Micro Software (SMSI) | |||
|---|---|---|---|
| 2.17 0.05 (2.36%) | 04-24 16:00 | ||
| Open: | 2.12 | Pre. Close: | 2.12 |
| High: | 2.215 | Low: | 2.12 |
| Volume: | 43,412 | Market Cap: | 21(M) |
| Stock Technical Analysis | |
|---|---|
| Overall: |  |
| Target: | Six months: 3.16 One year: 3.75 |
| Support: | Support1: 1.88 Support2: 1.56 |
| Resistance: | Resistance1: 2.70 Resistance2: 3.21 |
| Pivot: | 2.23 |
| Moving Averages: | MA(5): 2.16 MA(20): 2.35 MA(100): 4.83 MA(250): 7.63 |
| MACD: | MACD(12,26): -0.32 Signal(12,26,9): -0.38 |
| %K %D: | %K(14,3): 20.80 %D(3): 20.22 |
| RSI: | RSI(14): 36.25 |
| 52-Week: | High: 14.96 Low: 1.88 Change(%): -75.6 |
| Average Vol(K): | 3-Month: 158 10-Days: 656 |
| Prices Prediction (Update @5:00pm) | ||
|---|---|---|
| If tomorrow: | Open lower | Open higher |
| High: | 2.212 - 2.223 | 2.223 - 2.232 |
| Low: | 2.095 - 2.107 | 2.107 - 2.117 |
| Close: | 2.152 - 2.171 | 2.171 - 2.187 |
| Price, MAs and Bollinger Bands |
|---|
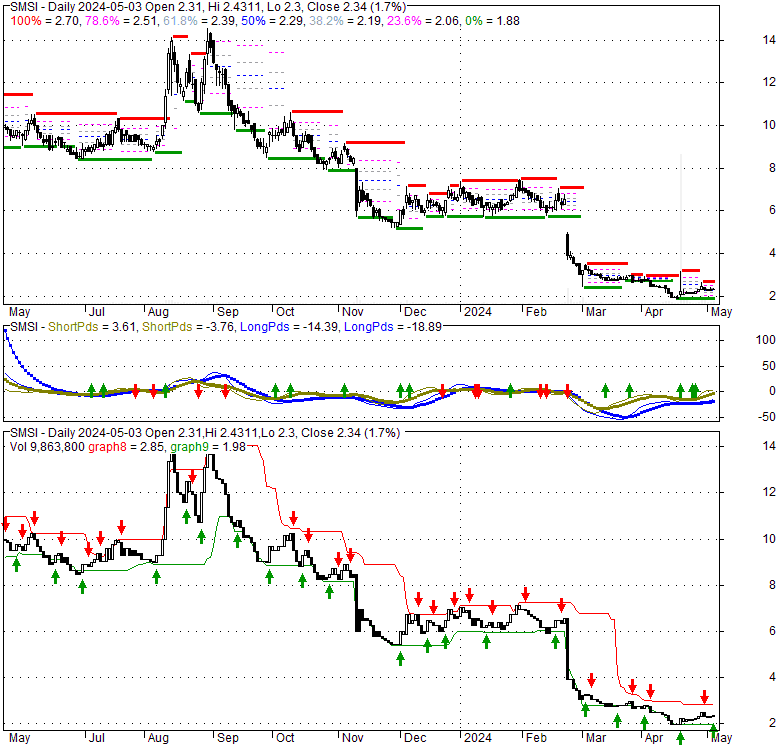
| Price has closed above its short-term moving average. Short-term moving average is currently below mid-term; and below long-term moving average. From the relationship between price and moving averages: This stock is NEUTRAL in short-term; and BEARISH in mid-long term.[ SMSI ] has closed above bottom band by 42.3%. Bollinger Bands are 52.3% narrower than normal. The narrow width of the bands suggests low volatility as compared to its normal range. The bands have been in this narrow range for 1 bars. This is a sign that the market may be about to initiate a new trend. |
| Company profile |
|---|
| Smith Micro Software, Inc. develops and sells software to enhance the mobile experience to wireless and cable service providers worldwide. It offers SafePath Family, SafePath IoT, and SafePath Home product suite, which provides tools to protect digital lifestyles and manage connected devices inside and outside the home; and CommSuite, a messaging platform that helps mobile service providers deliver a next-generation voicemail experience to mobile subscribers, as well as enables multi-language Voice-to-Text transcription messaging. It also offers ViewSpot, a retail display management platform that provides on-screen and interactive demos to wireless carriers and retailers; and technical support and customer services. The company was founded in 1982 and is headquartered in Pittsburgh, Pennsylvania. |
| Stock chart |
|---|
 |
| Financial Analysis | |
|---|---|
| Price to Book Value: | Outperform |
| P/BV, a ratio used to compare book value to its current market price, to gauge whether a stock is valued properly. | |
| Price to Earnings: | Underperform |
| PE, the ratio for valuing a company that measures its current share price relative to its earnings per share (EPS). | |
| Discounted cash flow: | Underperform |
| DCF, a valuation method used to estimate the value of an investment based on its expected future cash flows. | |
| Return on Assets: | Underperform |
| ROA, indicates how profitable a company is in relation to its total assets, how efficiently uses assets to generate a profit. | |
| Return on Equity: | Underperform |
| ROE, a measure of financial performance calculated by dividing net income by equity. a gauge of profitability and efficiency. | |
| Debt to Equity: | Underperform |
| evaluate financial leverage, reflects the ability of equity to cover outstanding debts in the event of a business downturn. | |
| Stock Basics & Statistics | |
|---|---|
| Exchange: NASDAQ Capital Market | |
| Sector: Technology | |
| Industry: Software - Application | |
| Shares Out. (M) | 9.60 |
| Shares Float (M) | 8.36 |
| % Held by Insiders | 10.73 |
| % Held by Institutions | 14.30 |
| Shares Short (K) | 119 |
| Shares Short Prior Month (K) | 76 |
| Stock Financials | |
|---|---|
| EPS | -3.040 |
| Book Value (p.s.) | 8.060 |
| Profit Margin | -59.70 |
| Operating Margin | -66.30 |
| Return on Assets (ttm) | -11.9 |
| Return on Equity (ttm) | -32.2 |
| Qtrly Rev. Growth | -24.7 |
| Gross Profit (p.s.) | |
| Sales Per Share | 4.256 |
| EBITDA (p.s.) | -1.110 |
| Qtrly Earnings Growth | |
| Operating Cash Flow (M) | -6.97 |
| Levered Free Cash Flow (M) | -4.42 |
| Stock Valuation | |
|---|---|
| PE Ratio | -0.71 |
| PEG Ratio | -0.22 |
| Price to Book value | 0.27 |
| Price to Sales | 0.51 |
| Price to Cash Flow | -2.99 |
| Stock Dividends | |
|---|---|
| Dividend | |
| Dividend Yield | |
| Dividend Growth | |