| Sonnet Biotherapeutics Holdings Inc (SONN) | |||
|---|---|---|---|
| 1.79 0.02 (1.13%) | 04-19 13:21 | ||
| Open: | 1.79 | Pre. Close: | 1.77 |
| High: | 1.89 | Low: | 1.77 |
| Volume: | 18,956 | Market Cap: | 5(M) |
| Stock Technical Analysis | |
|---|---|
| Overall: |  |
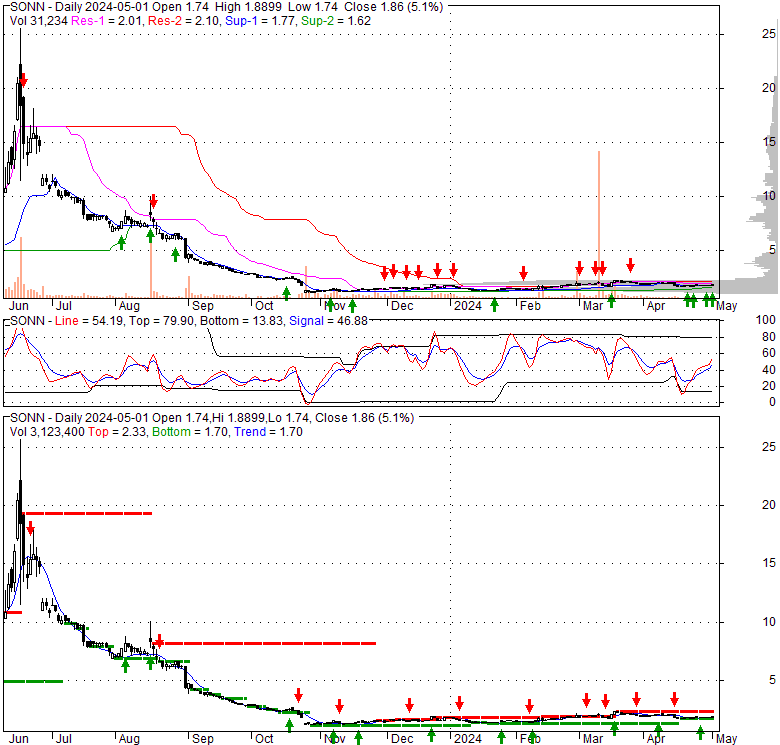
| Target: | Six months: 2.43 One year: 2.73 |
| Support: | Support1: 1.65 Support2: 1.37 |
| Resistance: | Resistance1: 2.08 Resistance2: 2.34 |
| Pivot: | 1.90 |
| Moving Averages: | MA(5): 1.79 MA(20): 1.95 MA(100): 1.68 MA(250): 4.40 |
| MACD: | MACD(12,26): -0.03 Signal(12,26,9): 0.01 |
| %K %D: | %K(14,3): 13.87 %D(3): 12.40 |
| RSI: | RSI(14): 43.32 |
| 52-Week: | High: 26.4 Low: 1.08 Change(%): -73.2 |
| Average Vol(K): | 3-Month: 107 10-Days: 23 |
| Prices Prediction (Update @5:00pm) | ||
|---|---|---|
| If tomorrow: | Open lower | Open higher |
| High: | 1.731 - 1.741 | 1.741 - 1.751 |
| Low: | 1.675 - 1.688 | 1.688 - 1.699 |
| Close: | 1.681 - 1.699 | 1.699 - 1.716 |
| Price, MAs and Bollinger Bands |
|---|
| Price has closed below its short-term moving average. Short-term moving average is currently below mid-term; and above long-term moving average. From the relationship between price and moving averages: This stock is BEARISH in short-term; and NEUTRAL in mid-long term.[ SONN ] has closed above bottom band by 20.8%. Bollinger Bands are 4.4% wider than normal. The current width of the bands does not suggest anything about the future direction or movement of prices. |
| Company profile |
|---|
| Sonnet BioTherapeutics Holdings, Inc., a clinical stage oncology-focused biotechnology company, develops platform for biologic medicines of single or bispecific action. The company develops fully human albumin binding technology, which utilizes human single chain antibodies fragment that binds to and hitch-hikes on human serum albumin for transport to target tissues. Its lead candidate is SON-1010, a fully human version of interleukin 12 for the treatment non-small cell lung cancer, and head and neck cancer. The company is also developing SON-080, a fully human version of interleukin 6 for chemotherapy-induced peripheral neuropathy and diabetic peripheral neuropathy. It has a license agreement with New Life Therapeutics PTE, LTD. to develop and commercialize pharmaceutical preparations containing a specific recombinant human interleukin 6. Sonnet BioTherapeutics Holdings, Inc. is based in Princeton, New Jersey. |
| Stock chart |
|---|
 |
| Financial Analysis | |
|---|---|
| Price to Book Value: | Outperform |
| P/BV, a ratio used to compare book value to its current market price, to gauge whether a stock is valued properly. | |
| Price to Earnings: | Neutral |
| PE, the ratio for valuing a company that measures its current share price relative to its earnings per share (EPS). | |
| Discounted cash flow: | Outperform |
| DCF, a valuation method used to estimate the value of an investment based on its expected future cash flows. | |
| Return on Assets: | Underperform |
| ROA, indicates how profitable a company is in relation to its total assets, how efficiently uses assets to generate a profit. | |
| Return on Equity: | Underperform |
| ROE, a measure of financial performance calculated by dividing net income by equity. a gauge of profitability and efficiency. | |
| Debt to Equity: | Neutral |
| evaluate financial leverage, reflects the ability of equity to cover outstanding debts in the event of a business downturn. | |
| Stock Basics & Statistics | |
|---|---|
| Exchange: NASDAQ Capital Market | |
| Sector: Healthcare | |
| Industry: Biotechnology | |
| Shares Out. (M) | |
| Shares Float (M) | 3.07 |
| % Held by Insiders | 2710000.00 |
| % Held by Institutions | 9.22 |
| Shares Short (K) | 254 |
| Shares Short Prior Month (K) | |
| Stock Financials | |
|---|---|
| EPS | -14450000.000 |
| Book Value (p.s.) | |
| Profit Margin | |
| Operating Margin | -6.00 |
| Return on Assets (ttm) | 866.0 |
| Return on Equity (ttm) | -175.8 |
| Qtrly Rev. Growth | 129180.0 |
| Gross Profit (p.s.) | -44.643 |
| Sales Per Share | |
| EBITDA (p.s.) | |
| Qtrly Earnings Growth | -0.83 |
| Operating Cash Flow (M) | |
| Levered Free Cash Flow (M) | -18.52 |
| Stock Valuation | |
|---|---|
| PE Ratio | |
| PEG Ratio | |
| Price to Book value | |
| Price to Sales | |
| Price to Cash Flow | 2.36 |
| Stock Dividends | |
|---|---|
| Dividend | |
| Dividend Yield | |
| Dividend Growth | 452180.000 |


