| Teligent Inc (TLGT) | |||
|---|---|---|---|
| 0.1735 -0.028 (-13.85%) | 12-31 19:00 | ||
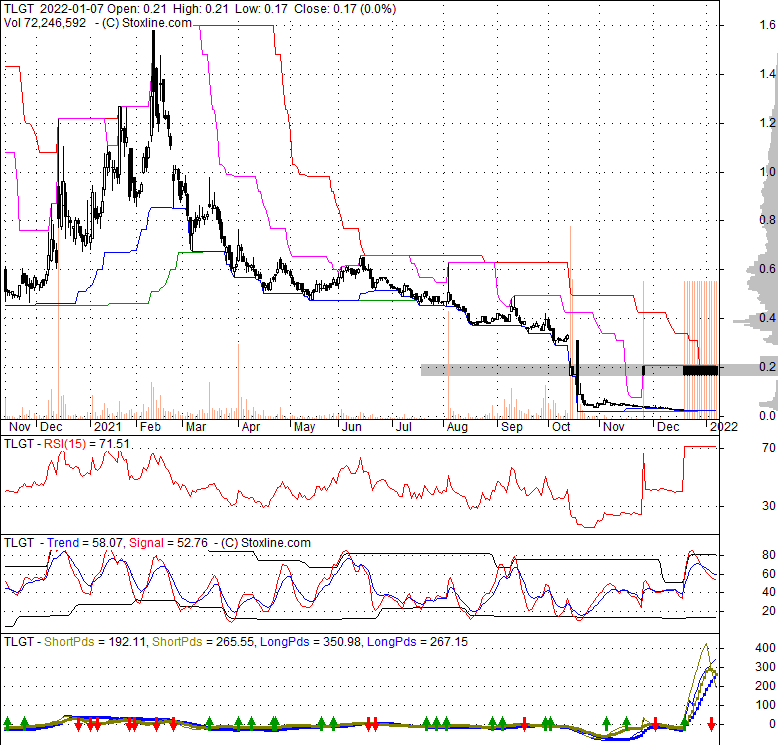
| Open: | 0.207 | Pre. Close: | 0.2014 |
| High: | 0.209 | Low: | 0.165 |
| Volume: | 72,246,596 | Market Cap: | 0(M) |
| Stock Technical Analysis | |
|---|---|
| Overall: |  |
| Target: | Six months: 0.24 One year: 0.29 |
| Support: | Support1: 0.10 Support2: 0.03 |
| Resistance: | Resistance1: 0.21 Resistance2: 0.24 |
| Pivot: | 0.16 |
| Moving Averages: | MA(5): 0.17 MA(20): 0.13 MA(100): 0.20 MA(250): 0.49 |
| MACD: | MACD(12,26): 0.03 Signal(12,26,9): 0.03 |
| %K %D: | %K(14,3): 80.63 %D(3): 80.65 |
| RSI: | RSI(14): 73.29 |
| 52-Week: | High: 1.6 Low: 0.02 Change(%): -83.8 |
| Average Vol(K): | 3-Month: 2026290 10-Days: 7224659 |
| Prices Prediction (Update @5:00pm) | ||
|---|---|---|
| If tomorrow: | Open lower | Open higher |
| High: | 0.21 - 0.212 | 0.212 - 0.212 |
| Low: | 0.168 - 0.169 | 0.169 - 0.17 |
| Close: | 0.168 - 0.17 | 0.17 - 0.172 |
| Price, MAs and Bollinger Bands |
|---|
| Price and moving averages has closed above its Short term moving average. Short term moving average is currently above mid-term; AND below long term moving averages. From the relationship between price and moving averages; we can see that: This stock is BULLISH in short-term; and NEUTRAL in mid-long term.TLGT has closed below upper band by 43.3%. Bollinger Bands are 5.3% narrower than normal. The current width of the bands does not suggest anything about the future direction or movement of prices. |
| Company profile |
|---|
| Teligent, Inc., formerly Igi Laboratories Inc, is a specialty generic pharmaceutical company. Under the Company's own label, it markets and sells generic injectable pharmaceutical products in the United States and Canada. In the United States it marketed 35 generic topical pharmaceutical products and four branded generic pharmaceutical products, as of December 31, 2018. It provides development, formulation and manufacturing services to the pharmaceutical, over-the-counter (OTC) and cosmetic industries. It focuses on developing, manufacturing and marketing a portfolio of generic pharmaceutical products under its own label in topical, injectable, complex and ophthalmic dosage forms, and managing its contract manufacturing and formulation services business. Its pipeline included 20 Abbreviated New Drug Application (ANDAs) filed with the United States Food and Drug Administration (FDA) for additional pharmaceutical products, as of December 31, 2018. |
| Stock chart |
|---|
 |
| Financial Analysis | |
|---|---|
| Price to Book Value: | Underperform |
| P/BV, a ratio used to compare book value to its current market price, to gauge whether a stock is valued properly. | |
| Price to Earnings: | Underperform |
| PE, the ratio for valuing a company that measures its current share price relative to its earnings per share (EPS). | |
| Discounted cash flow: | Outperform |
| DCF, a valuation method used to estimate the value of an investment based on its expected future cash flows. | |
| Return on Assets: | Underperform |
| ROA, indicates how profitable a company is in relation to its total assets, how efficiently uses assets to generate a profit. | |
| Return on Equity: | Outperform |
| ROE, a measure of financial performance calculated by dividing net income by equity. a gauge of profitability and efficiency. | |
| Debt to Equity: | Underperform |
| evaluate financial leverage, reflects the ability of equity to cover outstanding debts in the event of a business downturn. | |
| Stock Basics & Statistics | |
|---|---|
| Exchange: NASDAQ Global Select | |
| Sector: Healthcare | |
| Industry: Drug Manufacturers - Specialty & Generic | |
| Shares Out. (M) | 92.82 |
| Shares Float (M) | 92.77 |
| % Held by Insiders | 0.04 |
| % Held by Institutions | 13.01 |
| Shares Short (K) | 2210 |
| Shares Short Prior Month (K) | 623 |
| Stock Financials | |
|---|---|
| EPS | -4.309 |
| Book Value (p.s.) | -0.530 |
| Profit Margin | -197.78 |
| Operating Margin | -94.98 |
| Return on Assets (ttm) | -19.6 |
| Return on Equity (ttm) | |
| Qtrly Rev. Growth | -23.2 |
| Gross Profit (p.s.) | -0.040 |
| Sales Per Share | 0.499 |
| EBITDA (p.s.) | -0.422 |
| Qtrly Earnings Growth | |
| Operating Cash Flow (M) | -23.04 |
| Levered Free Cash Flow (M) | -8.94 |
| Stock Valuation | |
|---|---|
| PE Ratio | -0.04 |
| PEG Ratio | |
| Price to Book value | -0.33 |
| Price to Sales | 0.35 |
| Price to Cash Flow | -0.70 |
| Stock Dividends | |
|---|---|
| Dividend | |
| Dividend Yield | |
| Dividend Growth | |