| Tesla Inc (TSLA) | |||
|---|---|---|---|
| 147.05 -2.88 (-1.92%) | 04-19 16:00 | ||
| Open: | 148.97 | Pre. Close: | 149.93 |
| High: | 150.93 | Low: | 146.22 |
| Volume: | 85,876,816 | Market Cap: | 468,323(M) |
| Stock Technical Analysis | |
|---|---|
| Overall: |  |
| Target: | Six months: 198.24 One year: 215.20 |
| Support: | Support1: 146.22 Support2: 121.66 |
| Resistance: | Resistance1: 169.72 Resistance2: 184.25 |
| Pivot: | 165.64 |
| Moving Averages: | MA(5): 154.20 MA(20): 168.06 MA(100): 203.12 MA(250): 221.58 |
| MACD: | MACD(12,26): -7.08 Signal(12,26,9): -5.15 |
| %K %D: | %K(14,3): 4.18 %D(3): 6.08 |
| RSI: | RSI(14): 30.33 |
| 52-Week: | High: 299.29 Low: 146.22 Change(%): -10.9 |
| Average Vol(K): | 3-Month: 100251 10-Days: 90706 |
| Prices Prediction (Update @5:00pm) | ||
|---|---|---|
| If tomorrow: | Open lower | Open higher |
| High: | 151.916 - 153.373 | 153.373 - 154.255 |
| Low: | 143.13 - 145.031 | 145.031 - 146.181 |
| Close: | 144.884 - 147.959 | 147.959 - 149.819 |
| Price, MAs and Bollinger Bands |
|---|
| Price has closed below its short-term moving average. Short-term moving average is currently below mid-term; and below long-term moving average. From the relationship between price and moving averages: This stock is BEARISH in short-term; and BEARISH in mid-long term.[ TSLA ] has closed below the lower bollinger band by 1.0%. Although price has broken the lower band and a downside breakout is possible; the most likely direction for [ TSLA ] is to continue within current trading range. Bollinger Bands are 13.6% wider than normal. The current width of the bands does not suggest anything about the future direction or movement of prices. |
| Company profile |
|---|
| Tesla, Inc. designs, develops, manufactures, leases, and sells electric vehicles, and energy generation and storage systems in the United States, China, and internationally. It operates in two segments, Automotive, and Energy Generation and Storage. The Automotive segment offers electric vehicles, as well as sells automotive regulatory credits; and non-warranty after-sales vehicle, used vehicles, retail merchandise, and vehicle insurance services. This segment also provides sedans and sport utility vehicles through direct and used vehicle sales, a network of Tesla Superchargers, and in-app upgrades; purchase financing and leasing services; services for electric vehicles through its company-owned service locations and Tesla mobile service technicians; and vehicle limited warranties and extended service plans. The Energy Generation and Storage segment engages in the design, manufacture, installation, sale, and leasing of solar energy generation and energy storage products, and related services to residential, commercial, and industrial customers and utilities through its website, stores, and galleries, as well as through a network of channel partners; and provision of service and repairs to its energy product customers, including under warranty, as well as various financing options to its solar customers. The company was formerly known as Tesla Motors, Inc. and changed its name to Tesla, Inc. in February 2017. Tesla, Inc. was incorporated in 2003 and is headquartered in Austin, Texas. |
| Stock chart |
|---|
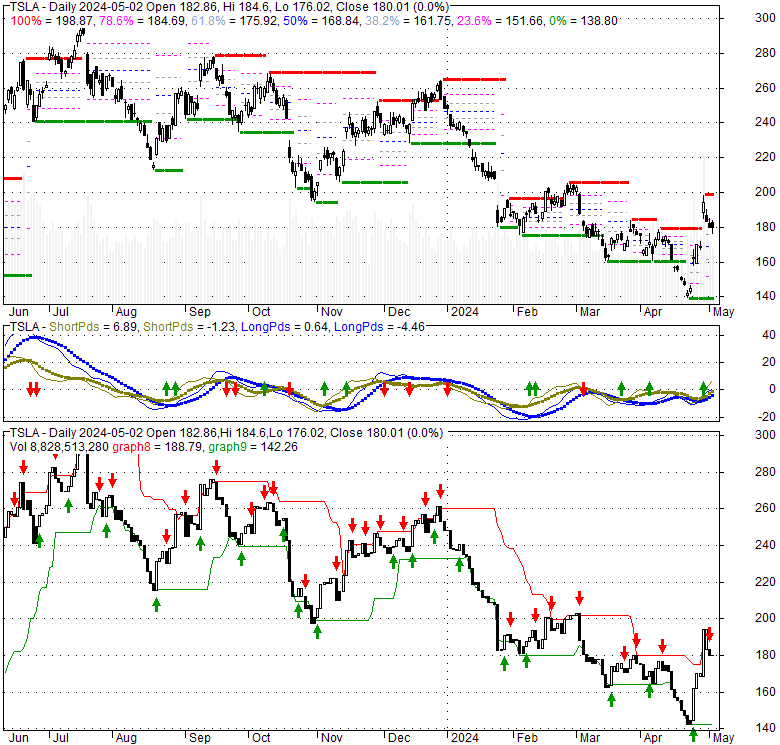 |
| Financial Analysis | |
|---|---|
| Price to Book Value: | Outperform |
| P/BV, a ratio used to compare book value to its current market price, to gauge whether a stock is valued properly. | |
| Price to Earnings: | Outperform |
| PE, the ratio for valuing a company that measures its current share price relative to its earnings per share (EPS). | |
| Discounted cash flow: | Neutral |
| DCF, a valuation method used to estimate the value of an investment based on its expected future cash flows. | |
| Return on Assets: | Outperform |
| ROA, indicates how profitable a company is in relation to its total assets, how efficiently uses assets to generate a profit. | |
| Return on Equity: | Outperform |
| ROE, a measure of financial performance calculated by dividing net income by equity. a gauge of profitability and efficiency. | |
| Debt to Equity: | Underperform |
| evaluate financial leverage, reflects the ability of equity to cover outstanding debts in the event of a business downturn. | |
| Stock Basics & Statistics | |
|---|---|
| Exchange: NASDAQ Global Select | |
| Sector: Consumer Cyclical | |
| Industry: Auto - Manufacturers | |
| Shares Out. (M) | 3180.00 |
| Shares Float (M) | 2770.00 |
| % Held by Insiders | 13.00 |
| % Held by Institutions | 45.71 |
| Shares Short (K) | 107480 |
| Shares Short Prior Month (K) | 95930 |
| Stock Financials | |
|---|---|
| EPS | 4.290 |
| Book Value (p.s.) | 19.670 |
| Profit Margin | 15.50 |
| Operating Margin | 8.20 |
| Return on Assets (ttm) | 5.9 |
| Return on Equity (ttm) | 27.4 |
| Qtrly Rev. Growth | 3.5 |
| Gross Profit (p.s.) | |
| Sales Per Share | 30.431 |
| EBITDA (p.s.) | 4.264 |
| Qtrly Earnings Growth | 111.50 |
| Operating Cash Flow (M) | 13260.00 |
| Levered Free Cash Flow (M) | 2230.00 |
| Stock Valuation | |
|---|---|
| PE Ratio | 34.28 |
| PEG Ratio | 4.16 |
| Price to Book value | 7.48 |
| Price to Sales | 4.83 |
| Price to Cash Flow | 35.27 |
| Stock Dividends | |
|---|---|
| Dividend | |
| Dividend Yield | |
| Dividend Growth | |


