| Take-Two Interactive (TTWO) | |||
|---|---|---|---|
| 142.83 1.11 (0.78%) | 04-24 16:00 | ||
| Open: | 140.97 | Pre. Close: | 141.72 |
| High: | 142.93 | Low: | 140.82 |
| Volume: | 1,022,213 | Market Cap: | 24,365(M) |
| Stock Technical Analysis | |
|---|---|
| Overall: |  |
| Target: | Six months: 174.78 One year: 182.50 |
| Support: | Support1: 138.94 Support2: 115.60 |
| Resistance: | Resistance1: 149.64 Resistance2: 156.25 |
| Pivot: | 146.62 |
| Moving Averages: | MA(5): 141.15 MA(20): 147.30 MA(100): 154.58 MA(250): 146.44 |
| MACD: | MACD(12,26): -2.19 Signal(12,26,9): -1.42 |
| %K %D: | %K(14,3): 14.81 %D(3): 9.94 |
| RSI: | RSI(14): 41.02 |
| 52-Week: | High: 171.59 Low: 119.57 Change(%): 17.5 |
| Average Vol(K): | 3-Month: 1824 10-Days: 1593 |
| Prices Prediction (Update @5:00pm) | ||
|---|---|---|
| If tomorrow: | Open lower | Open higher |
| High: | 143.173 - 143.857 | 143.857 - 144.478 |
| Low: | 139.106 - 139.916 | 139.916 - 140.651 |
| Close: | 141.502 - 142.827 | 142.827 - 144.03 |
| Price, MAs and Bollinger Bands |
|---|
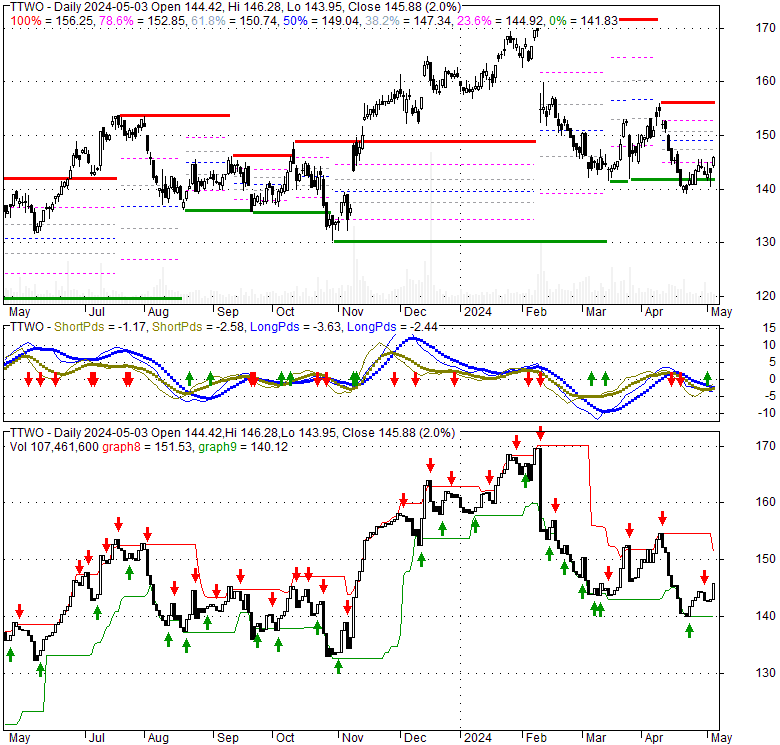
| Price has closed above its short-term moving average. Short-term moving average is currently below mid-term; and below long-term moving average. From the relationship between price and moving averages: This stock is NEUTRAL in short-term; and BEARISH in mid-long term.[ TTWO ] has closed above bottom band by 30.8%. Bollinger Bands are 63.3% wider than normal. The large width of the bands suggest high volatility as compared to its normal range. The bands have been in this wide range for 3 days. This is a sign that the current trend might continue. |
| Company profile |
|---|
| Take-Two Interactive Software, Inc. develops, publishes, and markets interactive entertainment solutions for consumers worldwide. The company offers its products under the Rockstar Games, 2K, Private Division, and T2 Mobile Games names. It develops and publishes action/adventure products under the Grand Theft Auto, Max Payne, Midnight Club, and Red Dead Redemption names; and offers episodes and content, as well as develops brands in other genres, including the LA Noire, Bully, and Manhunt franchises. The company also publishes various entertainment properties across various platforms and a range of genres, such as shooter, action, role-playing, strategy, sports, and family/casual entertainment under the BioShock, Mafia, Sid Meier's Civilization, XCOM series, and Borderlands. In addition, it publishes sports simulation titles comprising NBA 2K series, a basketball video game; the WWE 2K professional wrestling series; and PGA TOUR 2K. Further, the company offers Kerbal Space Program, OlliOlli World, and The Outer Worlds and Ancestors: the Humankind Odyssey under Private Division; and free-to-play mobile games, such as Dragon City, Monster Legends, Two Dots, and Top Eleven. Its products are designed for console gaming systems, including PlayStation 4 and PlayStation 5; Xbox One; the Nintendo's Switch; personal computers; and mobile comprising smartphones and tablets. The company provides its products through physical retail, digital download, online platforms, and cloud streaming services. Take-Two Interactive Software, Inc. was incorporated in 1993 and is based in New York, New York. |
| Stock chart |
|---|
 |
| Financial Analysis | |
|---|---|
| Price to Book Value: | Outperform |
| P/BV, a ratio used to compare book value to its current market price, to gauge whether a stock is valued properly. | |
| Price to Earnings: | Underperform |
| PE, the ratio for valuing a company that measures its current share price relative to its earnings per share (EPS). | |
| Discounted cash flow: | Outperform |
| DCF, a valuation method used to estimate the value of an investment based on its expected future cash flows. | |
| Return on Assets: | Underperform |
| ROA, indicates how profitable a company is in relation to its total assets, how efficiently uses assets to generate a profit. | |
| Return on Equity: | Underperform |
| ROE, a measure of financial performance calculated by dividing net income by equity. a gauge of profitability and efficiency. | |
| Debt to Equity: | Outperform |
| evaluate financial leverage, reflects the ability of equity to cover outstanding debts in the event of a business downturn. | |
| Stock Basics & Statistics | |
|---|---|
| Exchange: NASDAQ Global Select | |
| Sector: Technology | |
| Industry: Electronic Gaming & Multimedia | |
| Shares Out. (M) | 170.75 |
| Shares Float (M) | 158.05 |
| % Held by Insiders | 1.39 |
| % Held by Institutions | 99.16 |
| Shares Short (K) | 8490 |
| Shares Short Prior Month (K) | 6860 |
| Stock Financials | |
|---|---|
| EPS | -8.720 |
| Book Value (p.s.) | 49.900 |
| Profit Margin | -26.90 |
| Operating Margin | -5.57 |
| Return on Assets (ttm) | -1.6 |
| Return on Equity (ttm) | -16.1 |
| Qtrly Rev. Growth | -2.9 |
| Gross Profit (p.s.) | |
| Sales Per Share | 31.625 |
| EBITDA (p.s.) | 8.316 |
| Qtrly Earnings Growth | |
| Operating Cash Flow (M) | -41.90 |
| Levered Free Cash Flow (M) | 1680.00 |
| Stock Valuation | |
|---|---|
| PE Ratio | -16.38 |
| PEG Ratio | 1.18 |
| Price to Book value | 2.86 |
| Price to Sales | 4.52 |
| Price to Cash Flow | -582.06 |
| Stock Dividends | |
|---|---|
| Dividend | |
| Dividend Yield | |
| Dividend Growth | |