| Therapeuticsmd Inc (TXMD) | |||
|---|---|---|---|
| 1.9599 0.06 (3.15%) | 04-19 10:23 | ||
| Open: | 1.8801 | Pre. Close: | 1.9 |
| High: | 1.982 | Low: | 1.8801 |
| Volume: | 3,973 | Market Cap: | 23(M) |
| Stock Technical Analysis | |
|---|---|
| Overall: |  |
| Target: | Six months: 2.71 One year: 3.05 |
| Support: | Support1: 1.86 Support2: 1.55 |
| Resistance: | Resistance1: 2.32 Resistance2: 2.61 |
| Pivot: | 2.11 |
| Moving Averages: | MA(5): 1.92 MA(20): 2.15 MA(100): 2.31 MA(250): 3.03 |
| MACD: | MACD(12,26): -0.11 Signal(12,26,9): -0.08 |
| %K %D: | %K(14,3): 6.41 %D(3): 5.26 |
| RSI: | RSI(14): 23.48 |
| 52-Week: | High: 4.72 Low: 1.86 Change(%): -48.8 |
| Average Vol(K): | 3-Month: 22 10-Days: 34 |
| Prices Prediction (Update @5:00pm) | ||
|---|---|---|
| If tomorrow: | Open lower | Open higher |
| High: | 2.033 - 2.053 | 2.053 - 2.065 |
| Low: | 1.84 - 1.865 | 1.865 - 1.879 |
| Close: | 1.862 - 1.902 | 1.902 - 1.926 |
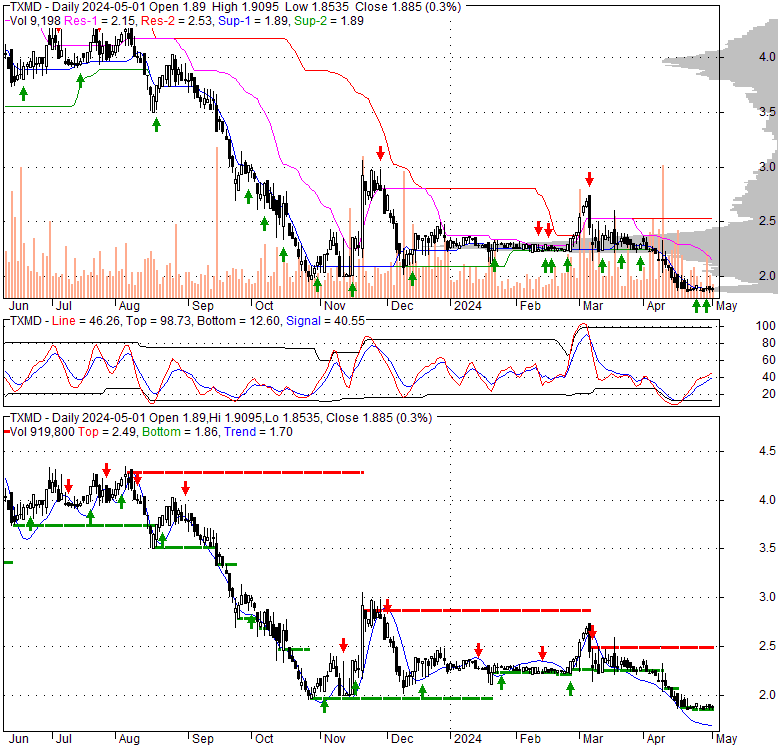
| Price, MAs and Bollinger Bands |
|---|
| Price has closed below its short-term moving average. Short-term moving average is currently below mid-term; and below long-term moving average. From the relationship between price and moving averages: This stock is BEARISH in short-term; and BEARISH in mid-long term.[ TXMD ] has closed above bottom band by 12.4%. Bollinger Bands are 34.6% wider than normal. The current width of the bands does not suggest anything about the future direction or movement of prices. |
| Company profile |
|---|
| TherapeuticsMD, Inc. operates as a women's healthcare company in the United States. The company offers IMVEXXY for the treatment of moderate-to-severe dyspareunia; BIJUVA, a bio-identical hormone therapy combination of 17ß-estradiol and progesterone for the treatment of moderate-to-severe vasomotor symptoms; and ANNOVERA, a ring-shaped contraceptive vaginal system. Its preclinical projects include the development of TX-005HR, a progesterone-alone transdermal cream; TX-006HR, an estradiol and progesterone transdermal cream; TX-007HR and TX-008HR, which are transdermal patch product candidates; and TX-009HR, an oral progesterone and estradiol formulation. It also manufactures and distributes branded and generic prescription prenatal vitamins under the vitaTrue, vitaPearl, vitaMedMD, and BocaGreenMD Prena1 brands. The company sells its prescription pharmaceutical products and prenatal vitamin products to wholesale distributors and retail pharmacy distributors. TherapeuticsMD, Inc. was founded in 2008 and is headquartered in Boca Raton, Florida. |
| Stock chart |
|---|
 |
| Financial Analysis | |
|---|---|
| Price to Book Value: | Neutral |
| P/BV, a ratio used to compare book value to its current market price, to gauge whether a stock is valued properly. | |
| Price to Earnings: | Underperform |
| PE, the ratio for valuing a company that measures its current share price relative to its earnings per share (EPS). | |
| Discounted cash flow: | Underperform |
| DCF, a valuation method used to estimate the value of an investment based on its expected future cash flows. | |
| Return on Assets: | Neutral |
| ROA, indicates how profitable a company is in relation to its total assets, how efficiently uses assets to generate a profit. | |
| Return on Equity: | Underperform |
| ROE, a measure of financial performance calculated by dividing net income by equity. a gauge of profitability and efficiency. | |
| Debt to Equity: | Neutral |
| evaluate financial leverage, reflects the ability of equity to cover outstanding debts in the event of a business downturn. | |
| Stock Basics & Statistics | |
|---|---|
| Exchange: NASDAQ Global Select | |
| Sector: Healthcare | |
| Industry: Drug Manufacturers - Specialty & Generic | |
| Shares Out. (M) | 11.53 |
| Shares Float (M) | 9.91 |
| % Held by Insiders | 3.78 |
| % Held by Institutions | 28.20 |
| Shares Short (K) | 45 |
| Shares Short Prior Month (K) | 41 |
| Stock Financials | |
|---|---|
| EPS | -0.740 |
| Book Value (p.s.) | 2.540 |
| Profit Margin | |
| Operating Margin | -320.92 |
| Return on Assets (ttm) | -8.0 |
| Return on Equity (ttm) | -23.9 |
| Qtrly Rev. Growth | -99.3 |
| Gross Profit (p.s.) | |
| Sales Per Share | 0.113 |
| EBITDA (p.s.) | -0.729 |
| Qtrly Earnings Growth | |
| Operating Cash Flow (M) | -48.14 |
| Levered Free Cash Flow (M) | -34.19 |
| Stock Valuation | |
|---|---|
| PE Ratio | -2.55 |
| PEG Ratio | |
| Price to Book value | 0.74 |
| Price to Sales | 16.76 |
| Price to Cash Flow | -0.45 |
| Stock Dividends | |
|---|---|
| Dividend | |
| Dividend Yield | |
| Dividend Growth | |


