| Univar Inc (UNVR) | |||
|---|---|---|---|
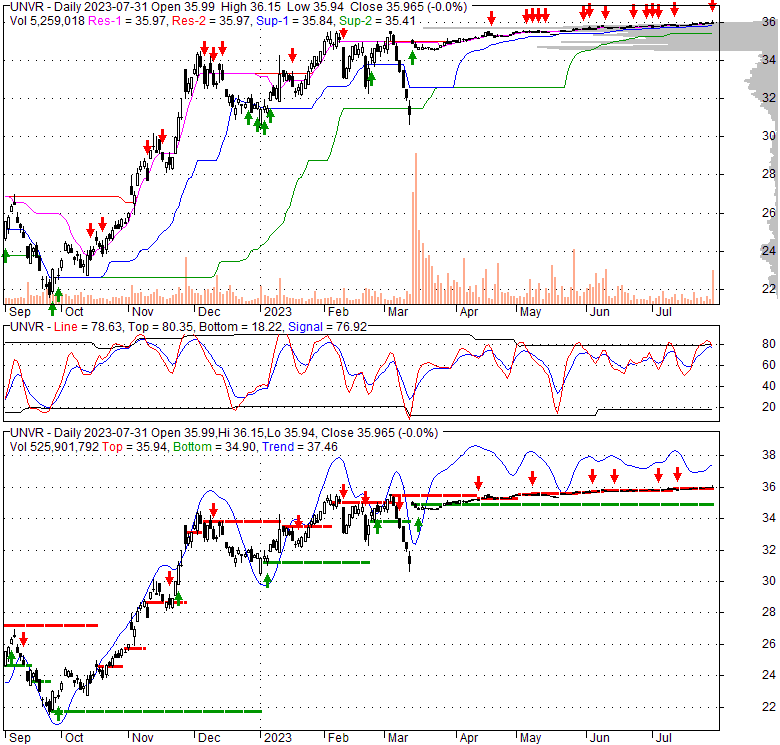
| 36.14 0.17 (0.47%) | 07-31 16:00 | ||
| Open: | 35.99 | Pre. Close: | 35.97 |
| High: | 36.15 | Low: | 35.94 |
| Volume: | 5,259,018 | Market Cap: | 5,701(M) |
| Stock Technical Analysis | |
|---|---|
| Overall: |  |
| Target: | Six months: 42.22 One year: 49.32 |
| Support: | Support1: 35.90 Support2: 35.75 |
| Resistance: | Resistance1: 36.15 Resistance2: 42.22 |
| Pivot: | 35.90 |
| Moving Averages: | MA(5): 35.96 MA(20): 35.88 MA(100): 35.35 MA(250): 31.66 |
| MACD: | MACD(12,26): 0.06 Signal(12,26,9): 0.06 |
| %K %D: | %K(14,3): 68.35 %D(3): 71.47 |
| RSI: | RSI(14): 65.56 |
| 52-Week: | High: 36.15 Low: 21.49 Change(%): 32.9 |
| Average Vol(K): | 3-Month: 2004 10-Days: 1392 |
| Prices Prediction (Update @5:00pm) | ||
|---|---|---|
| If tomorrow: | Open lower | Open higher |
| High: | 36.187 - 36.385 | 36.385 - 36.549 |
| Low: | 35.45 - 35.702 | 35.702 - 35.911 |
| Close: | 35.592 - 35.975 | 35.975 - 36.293 |
| Price, MAs and Bollinger Bands |
|---|
| Price has closed above its short-term moving average. Short-term moving average is currently above mid-term; and above long-term moving average. From the relationship between price and moving averages: This stock is BULLISH in short-term; and BULLISH in mid-long term.[ UNVR ] has closed below upper band by 19.2%. Bollinger Bands are 79.4% narrower than normal. The narrow width of the bands suggests low volatility as compared to its normal range. The bands have been in this narrow range for 81 bars. This is a sign that the market may be about to initiate a new trend. |
| Company profile |
|---|
| Univar Solutions Inc. distributes commodity and specialty chemical products, and provides related services worldwide. It offers epoxy resins, polyurethanes, titanium dioxide, fumed silica, esters, plasticizers, silicones, and specialty amines; ingredients for cleaners, detergents, and disinfectant products; and base stocks, performance-enhancing additives for lubricants and metalworking fluids. The company also distributes specialty and basic chemicals, and ingredients used in skin and hair care products; and commodity and specialty products for meat processing, baked goods, dairy, grain mill products, processed foods, carbonated soft drinks, fruit drinks, and alcoholic beverage markets, as well as provides excipients, solvents, reactants, active pharmaceutical ingredients, and intermediates to pharmaceutical ingredient producers. In addition, it offers chemical products for use at various stages of production, from sap stain prevention to pulp and paper manufacturing; and chemistries and products used to sanitize, balance, and supplement municipal and industrial water. Further, the company provides chemicals to midstream pipeline and downstream refinery operators, as well as chemicals and services to upstream oil and gas sector for offshore production, oil extraction, and waste management activities. Additionally, it offers transportation and warehousing services, chemicals and hazardous materials handling, waste management services, inventory management, and blending, mixing, and repackaging services. Univar Solutions Inc. distributes its products through warehouse and direct-to-consumer delivery channels. The company was formerly known as Univar Inc. and changed its name to Univar Solutions Inc. in September 2019. Univar Solutions Inc. was founded in 1924 and is headquartered in Downers Grove, Illinois. |
| Stock chart |
|---|
 |
| Financial Analysis | |
|---|---|
| Price to Book Value: | Outperform |
| P/BV, a ratio used to compare book value to its current market price, to gauge whether a stock is valued properly. | |
| Price to Earnings: | Outperform |
| PE, the ratio for valuing a company that measures its current share price relative to its earnings per share (EPS). | |
| Discounted cash flow: | Outperform |
| DCF, a valuation method used to estimate the value of an investment based on its expected future cash flows. | |
| Return on Assets: | Outperform |
| ROA, indicates how profitable a company is in relation to its total assets, how efficiently uses assets to generate a profit. | |
| Return on Equity: | Outperform |
| ROE, a measure of financial performance calculated by dividing net income by equity. a gauge of profitability and efficiency. | |
| Debt to Equity: | Outperform |
| evaluate financial leverage, reflects the ability of equity to cover outstanding debts in the event of a business downturn. | |
| Stock Basics & Statistics | |
|---|---|
| Exchange: New York Stock Exchange | |
| Sector: Basic Materials | |
| Industry: Chemicals | |
| Shares Out. (M) | |
| Shares Float (M) | |
| % Held by Insiders | |
| % Held by Institutions | |
| Shares Short (K) | |
| Shares Short Prior Month (K) | |
| Stock Financials | |
|---|---|
| EPS | |
| Book Value (p.s.) | |
| Profit Margin | |
| Operating Margin | |
| Return on Assets (ttm) | |
| Return on Equity (ttm) | |
| Qtrly Rev. Growth | |
| Gross Profit (p.s.) | 17.687 |
| Sales Per Share | 71.510 |
| EBITDA (p.s.) | 6.042 |
| Qtrly Earnings Growth | |
| Operating Cash Flow (M) | |
| Levered Free Cash Flow (M) | |
| Stock Valuation | |
|---|---|
| PE Ratio | |
| PEG Ratio | |
| Price to Book value | |
| Price to Sales | 0.50 |
| Price to Cash Flow | |
| Stock Dividends | |
|---|---|
| Dividend | |
| Dividend Yield | |
| Dividend Growth | |


