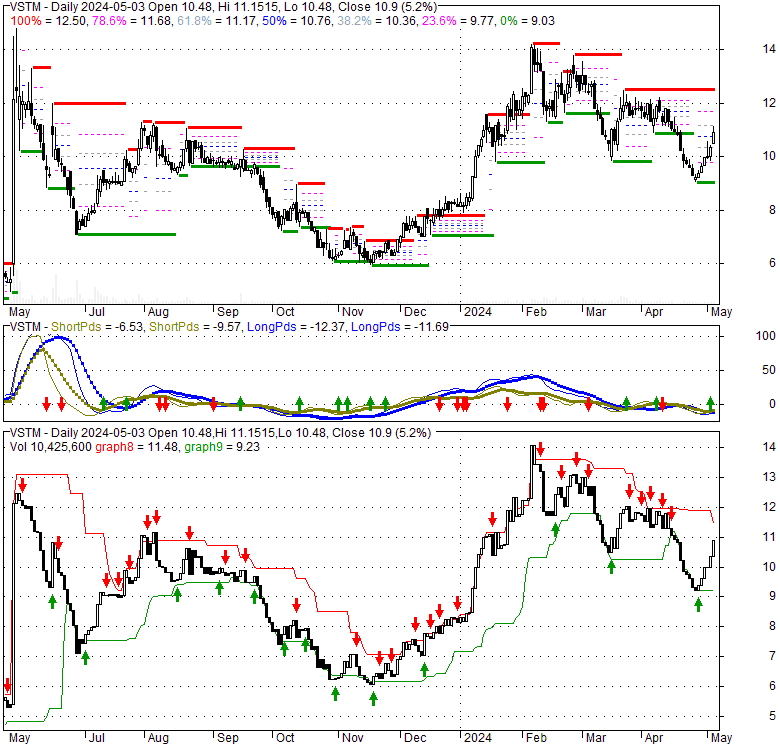
| Verastem Inc (VSTM) | |||
|---|---|---|---|
| 9.31 -0.3 (-3.12%) | 04-24 16:00 | ||
| Open: | 9.54 | Pre. Close: | 9.61 |
| High: | 9.75 | Low: | 9.27 |
| Volume: | 78,623 | Market Cap: | 236(M) |
| Stock Technical Analysis | |
|---|---|
| Overall: |  |
| Target: | Six months: 13.16 One year: 14.60 |
| Support: | Support1: 9.27 Support2: 7.71 |
| Resistance: | Resistance1: 11.27 Resistance2: 12.50 |
| Pivot: | 10.82 |
| Moving Averages: | MA(5): 9.75 MA(20): 11.06 MA(100): 10.63 MA(250): 9.25 |
| MACD: | MACD(12,26): -0.53 Signal(12,26,9): -0.32 |
| %K %D: | %K(14,3): 3.29 %D(3): 5.30 |
| RSI: | RSI(14): 29.15 |
| 52-Week: | High: 15.12 Low: 4.32 Change(%): 109.7 |
| Average Vol(K): | 3-Month: 147 10-Days: 89 |
| Prices Prediction (Update @5:00pm) | ||
|---|---|---|
| If tomorrow: | Open lower | Open higher |
| High: | 9.814 - 9.908 | 9.908 - 9.965 |
| Low: | 9.074 - 9.195 | 9.195 - 9.267 |
| Close: | 9.173 - 9.368 | 9.368 - 9.485 |
| Price, MAs and Bollinger Bands |
|---|
| Price has closed below its short-term moving average. Short-term moving average is currently below mid-term; and below long-term moving average. From the relationship between price and moving averages: This stock is BEARISH in short-term; and NEUTRAL in mid-long term.[ VSTM ] has closed above bottom band by 4.4%. Bollinger Bands are 37.9% wider than normal. The current width of the bands does not suggest anything about the future direction or movement of prices. |
| Company profile |
|---|
| Verastem, Inc., a development-stage biopharmaceutical company, focusing on developing and commercializing drugs for the treatment of cancer. Its product in development includes VS-6766, a dual rapidly accelerated fibrosarcoma (RAF)/mitogen-activated protein kinase (MEK) clamp that blocks MEK kinase activity and the ability of RAF to phosphorylate MEK. The company also engages in developing RAMP 201, an adaptive two-part multicenter, parallel cohort, randomized open label trial to evaluate the efficacy and safety of VS-6766 and in combination with defactinib, an oral small molecule inhibitor of focal adhesion kinase (FAK) in patients with recurrent low grade serous ovarian cancer; and RAMP 202, which is in Phase 2 trial to evaluate the safety of VS-6766 in combination with defactinib in patients with KRAS and BRAF mutant non-small cell lung cancer following treatment with a platinum-based regimen and immune checkpoint inhibitor. Verastem, Inc. has license agreements with Chugai Pharmaceutical Co., Ltd. for the development, commercialization, and manufacture of products containing VS-6766; and Pfizer Inc. to research, develop, manufacture, and commercialize products containing Pfizer's inhibitors of FAK for therapeutic, diagnostic and prophylactic uses in humans. In addition, it has clinical collaboration agreement with Amgen, Inc. to evaluate the combination of VS-6766 with Amgen's KRAS-G12C inhibitor LUMAKRASTM which in Phase 1/2 trial entitled RAMP 203. The company was incorporated in 2010 and is headquartered in Needham, Massachusetts. |
| Stock chart |
|---|
 |
| Financial Analysis | |
|---|---|
| Price to Book Value: | Outperform |
| P/BV, a ratio used to compare book value to its current market price, to gauge whether a stock is valued properly. | |
| Price to Earnings: | Underperform |
| PE, the ratio for valuing a company that measures its current share price relative to its earnings per share (EPS). | |
| Discounted cash flow: | Neutral |
| DCF, a valuation method used to estimate the value of an investment based on its expected future cash flows. | |
| Return on Assets: | Underperform |
| ROA, indicates how profitable a company is in relation to its total assets, how efficiently uses assets to generate a profit. | |
| Return on Equity: | Underperform |
| ROE, a measure of financial performance calculated by dividing net income by equity. a gauge of profitability and efficiency. | |
| Debt to Equity: | Outperform |
| evaluate financial leverage, reflects the ability of equity to cover outstanding debts in the event of a business downturn. | |
| Stock Basics & Statistics | |
|---|---|
| Exchange: NASDAQ Global Market | |
| Sector: Healthcare | |
| Industry: Biotechnology | |
| Shares Out. (M) | 25.31 |
| Shares Float (M) | 13.68 |
| % Held by Insiders | 0.57 |
| % Held by Institutions | 66.78 |
| Shares Short (K) | 634 |
| Shares Short Prior Month (K) | 763 |
| Stock Financials | |
|---|---|
| EPS | -3.960 |
| Book Value (p.s.) | 2.270 |
| Profit Margin | |
| Operating Margin | |
| Return on Assets (ttm) | -47.0 |
| Return on Equity (ttm) | -138.8 |
| Qtrly Rev. Growth | |
| Gross Profit (p.s.) | |
| Sales Per Share | |
| EBITDA (p.s.) | -3.636 |
| Qtrly Earnings Growth | |
| Operating Cash Flow (M) | -86.46 |
| Levered Free Cash Flow (M) | -50.95 |
| Stock Valuation | |
|---|---|
| PE Ratio | -2.35 |
| PEG Ratio | -1.56 |
| Price to Book value | 4.10 |
| Price to Sales | |
| Price to Cash Flow | -2.73 |
| Stock Dividends | |
|---|---|
| Dividend | |
| Dividend Yield | |
| Dividend Growth | |