| Western Alliance Bancorp (WAL) | |||
|---|---|---|---|
| 55.49 0.21 (0.38%) | 04-17 16:00 | ||
| Open: | 56.37 | Pre. Close: | 55.28 |
| High: | 56.97 | Low: | 54.88 |
| Volume: | 742,481 | Market Cap: | 6,114(M) |
| Stock Technical Analysis | |
|---|---|
| Overall: |  |
| Target: | Six months: 70.98 One year: 75.51 |
| Support: | Support1: 54.50 Support2: 45.34 |
| Resistance: | Resistance1: 60.77 Resistance2: 64.65 |
| Pivot: | 59.56 |
| Moving Averages: | MA(5): 56.21 MA(20): 60.19 MA(100): 60.28 MA(250): 49.68 |
| MACD: | MACD(12,26): -1.13 Signal(12,26,9): -0.43 |
| %K %D: | %K(14,3): 9.04 %D(3): 8.19 |
| RSI: | RSI(14): 36.16 |
| 52-Week: | High: 70.23 Low: 11.35 Change(%): 37.5 |
| Average Vol(K): | 3-Month: 1507 10-Days: 921 |
| Prices Prediction (Update @5:00pm) | ||
|---|---|---|
| If tomorrow: | Open lower | Open higher |
| High: | 56.997 - 57.341 | 57.341 - 57.671 |
| Low: | 54.08 - 54.478 | 54.478 - 54.86 |
| Close: | 54.88 - 55.466 | 55.466 - 56.028 |
| Price, MAs and Bollinger Bands |
|---|
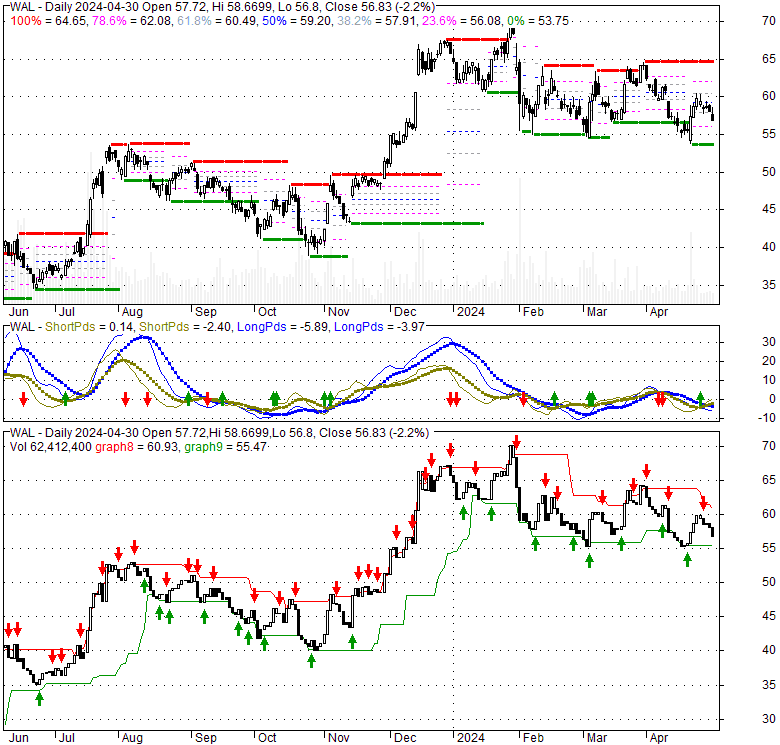
| Price has closed below its short-term moving average. Short-term moving average is currently below mid-term; and below long-term moving average. From the relationship between price and moving averages: This stock is BEARISH in short-term; and BEARISH in mid-long term.[ WAL ] has closed above bottom band by 14.8%. Bollinger Bands are 17% wider than normal. The current width of the bands does not suggest anything about the future direction or movement of prices. |
| Company profile |
|---|
| Western Alliance Bancorporation operates as the bank holding company for Western Alliance Bank that provides various banking products and related services primarily in Arizona, California, and Nevada. It operates in Commercial, Consumer Related, and Corporate & Other segments. The company offers deposit products, including checking, savings, and money market accounts, as well as fixed-rate and fixed maturity certificates of deposit accounts; and treasury management and residential mortgage products and services. It also offers commercial and industrial loan products, such as working capital lines of credit, loans to technology companies, inventory and accounts receivable lines, mortgage warehouse lines, equipment loans and leases, and other commercial loans; commercial real estate loans, which are secured by multi-family residential properties, professional offices, industrial facilities, retail centers, hotels, and other commercial properties; construction and land development loans for single family and multi-family residential projects, industrial/warehouse properties, office buildings, retail centers, medical office facilities, and residential lot developments; and consumer loans. In addition, the company provides other financial services, such as internet banking, wire transfers, electronic bill payment and presentment, lock box services, courier, and cash management services. Further, it holds certain investment securities, municipal and non-profit loans, and leases; invests primarily in low-income housing tax credits and small business investment corporations; and holds certain real estate loans and related securities. The company operates 36 branch locations, as well as loan production offices. Western Alliance Bancorporation was founded in 1994 and is headquartered in Phoenix, Arizona. |
| Stock chart |
|---|
 |
| Financial Analysis | |
|---|---|
| Price to Book Value: | Outperform |
| P/BV, a ratio used to compare book value to its current market price, to gauge whether a stock is valued properly. | |
| Price to Earnings: | Outperform |
| PE, the ratio for valuing a company that measures its current share price relative to its earnings per share (EPS). | |
| Discounted cash flow: | Outperform |
| DCF, a valuation method used to estimate the value of an investment based on its expected future cash flows. | |
| Return on Assets: | Outperform |
| ROA, indicates how profitable a company is in relation to its total assets, how efficiently uses assets to generate a profit. | |
| Return on Equity: | Neutral |
| ROE, a measure of financial performance calculated by dividing net income by equity. a gauge of profitability and efficiency. | |
| Debt to Equity: | Outperform |
| evaluate financial leverage, reflects the ability of equity to cover outstanding debts in the event of a business downturn. | |
| Stock Basics & Statistics | |
|---|---|
| Exchange: New York Stock Exchange | |
| Sector: Financial Services | |
| Industry: Banks - Regional | |
| Shares Out. (M) | 110.18 |
| Shares Float (M) | 103.18 |
| % Held by Insiders | 1.60 |
| % Held by Institutions | 82.21 |
| Shares Short (K) | 5020 |
| Shares Short Prior Month (K) | 5140 |
| Stock Financials | |
|---|---|
| EPS | 6.540 |
| Book Value (p.s.) | 53.370 |
| Profit Margin | 28.25 |
| Operating Margin | 41.66 |
| Return on Assets (ttm) | |
| Return on Equity (ttm) | 12.6 |
| Qtrly Rev. Growth | -3.6 |
| Gross Profit (p.s.) | |
| Sales Per Share | 23.235 |
| EBITDA (p.s.) | |
| Qtrly Earnings Growth | -50.00 |
| Operating Cash Flow (M) | -328.60 |
| Levered Free Cash Flow (M) | |
| Stock Valuation | |
|---|---|
| PE Ratio | 8.48 |
| PEG Ratio | -0.55 |
| Price to Book value | 1.04 |
| Price to Sales | 2.39 |
| Price to Cash Flow | -18.61 |
| Stock Dividends | |
|---|---|
| Dividend | |
| Dividend Yield | |
| Dividend Growth | |